Skip to content
Skip to main content
Ahosting Logo
  • Hosting
    • WordPress Hosting
      Fast, secure hosting for WordPress sites
    • Web Hosting
      Reliable, affordable hosting for sites
    • FFMpeg Hosting
      Fast hosting for FFmpeg projects
    • Reseller Hosting
      Start hosting biz with white-label plans
    • VPS Hosting
      Scalable VPS with full control & power
    • Dedicated Server
      High-power servers for max security
    • WooCommerce Hosting
      Fast hosting for WooCommerce shops
  • Domain
    • Register a Domain
      Secure your domain name in minutes
    • Domain Transfer
      Move domains to Ahosting with ease
    • Premium SSL Certificate
      Enterprise SSL to build customer trust
  • Support
    • Submit A Ticket
      Expert 24/7 help from our support team
    • Abuse Report
      Report abuse to keep network safe
    • Knowledge Base
      Quick answers via step-by-step guides
  • Company
    • Blog
      Expert articles to power your online growth
    • Compare Hosts
      Side-by-side comparison
    • Datacenter
      Secure, high tech datacenter for hosting
    • About Us
      Learn about our mission, values & team
    • Contact Us
      Contact sales for plans, pricing & advice
    • Sitemap
      Find info fast with our clear site map
My Account
Ahosting Logo
  • Hosting
    • Web Hosting
    • WordPress Hosting
    • FFMpeg Hosting
    • Reseller Hosting
    • VPS Hosting
    • Dedicated Server
    • WooCommerce Hosting
  • Domain
    • Register a Domain
    • Domain Transfer
    • Premium SSL Certificate
  • Support
    • Knowledge Base
    • Abuse Report
    • Submit A Ticket
  • Company
    • About Us
    • Contact Us
    • Blog
    • Sitemap
    • Datacenter
  • Legal
    • Privacy Policy
    • Terms of Service
    • Acceptable Use Policy
    • Service Level Agreement
    • Resource Abuse Policy
My Account

AHosting Blog

Category: WordPress

  • You Should Use a Persistent Object Cache: What WordPress Site Health Actually Measures

    You Should Use a Persistent Object Cache: What WordPress Site Health Actually Measures

    • What You Should Use a Persistent Object Cache Actually Means
      • What a Persistent Object Cache Is
      • Why the Persistent Object Cache Notice Mentions Your Host
    • The Seven Limits Behind the Persistent Object Cache Recommendation
      • A Size Test, Not a Speed Test
    • Why a Small Site Trips the Persistent Object Cache Check
      • The Posts Table Holds Sixteen Kinds of Content
      • Revisions Are the Usual Reason
      • The Row Count Is an Estimate
    • What Your Host Appears to Support Redis Means for a Persistent Object Cache
      • The Check Asks PHP, Not the Server
      • Three Kinds of Name on That List
    • Can You Run a Persistent Object Cache on Shared Hosting
      • Our Answer, Checked on Our Own Servers
      • Why Installing a Plugin Does Nothing on Its Own
      • Never Borrow a Cache Server You Did Not Set Up
    • Does Your Site Actually Need a Persistent Object Cache
      • The Page Cache Comes First
      • Traffic an Object Cache Helps
      • How to Measure It Before Deciding
    • How to Clear the Persistent Object Cache Notice Honestly
      • Find Which Limit Fired
      • Three Ways to Resolve It
      • Reducing the Counts
      • Recording the Decision in Code
    • When a Persistent Object Cache Is Worth Moving For
      • Where the Work Stops Being Yours
      • A Short Checklist
    • Frequently Asked Questions About the Persistent Object Cache Notice
      • Is the persistent object cache warning in Site Health necessary to fix?
      • Why does Site Health say I should use a persistent object cache in 2026?
      • Can I use a persistent object cache on AHosting shared or WordPress hosting?
      • Persistent object cache vs page cache: which one does my WordPress site need?
      • Redis vs Memcached for a WordPress persistent object cache: does the choice matter?
      • Why does my small blog trigger the persistent object cache recommendation?
      • Does installing a Redis plugin clear the warning on shared hosting in 2026?
      • What does your host appears to support Redis mean in Site Health?
      • When is it worth moving to an AHosting VPS for a persistent object cache in 2026?
      • Does AHosting LiteSpeed caching replace the need for an object cache?
    TL;DR

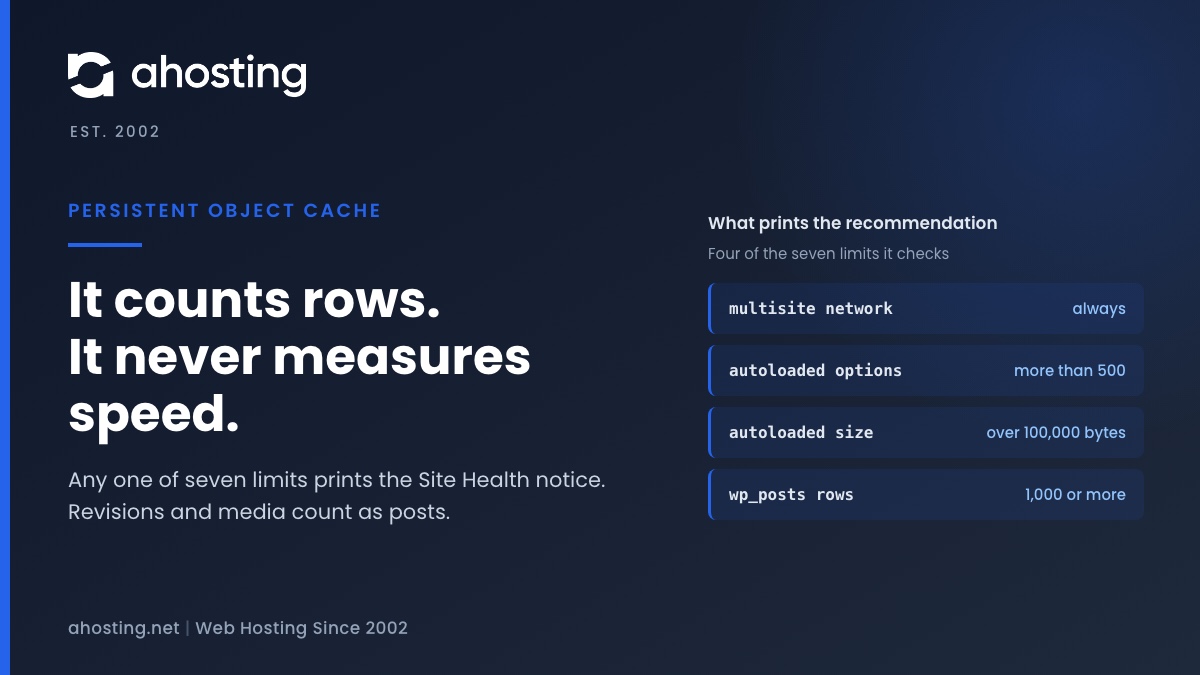
    Site Health recommends a persistent object cache when your site crosses a size line, not when it is slow. Any one of seven counters is enough: a multisite network, more than 500 autoloaded options or 100,000 bytes of them, or 1,000 rows in the posts, comments, options, terms or users table. Revisions and media count as posts, so small sites trip it often. An object cache also needs a cache server, and a plugin alone cannot provide one. Decide first whether your traffic is the kind an object cache speeds up.

    What You Should Use a Persistent Object Cache Actually Means

    When WordPress Site Health prints You should use a persistent object cache, it has not found a fault. It has counted a few things about your database, found that one of them crossed a fixed line, and concluded that a site of this size would probably benefit from keeping some data in memory between visits. The notice sits under the Performance badge as a recommendation, never as a critical issue. Nothing in the test measures how fast your pages load or how many people visit them.

    What a Persistent Object Cache Is

    WordPress already caches. Every request builds a private store in memory for settings, posts and query results it has already looked up, so it does not ask the database twice for the same thing. At the end of the request that store is thrown away, and the next visitor starts from nothing. That is the non-persistent object cache, and every site has it. A persistent object cache keeps the same store in a separate memory server, usually Redis or Memcached, so it survives from one request to the next. WordPress switches to it when a drop-in file named object-cache.php is present in the content directory.

    Why the Persistent Object Cache Notice Mentions Your Host

    Below the heading, the notice adds that your hosting provider can tell you whether a persistent object cache can be enabled. That sentence is the honest part of the message. The official WordPress optimization handbook puts it more plainly: your hosting provider must offer you a cache server before any of this works. A plugin is the connector, the server is the cache, and without the server there is nothing to connect to.

    The Seven Limits Behind the Persistent Object Cache Recommendation

    The decision comes from one short function in core, and every result can be predicted from it. We read it at the WordPress 7.1.2 tag, the current release on 25 September 2026, and compared it with 6.1.0, where the test first appeared. The limits and their order have not changed in between; 7.1 only rewrote the final loop in a newer PHP style. The table lists what is checked, in the order core checks it.

    CheckRecommendation appears whenWhat it counts
    Environment typeOnly tested when it is productionThe environment setting in the site configuration
    Drop-in already loadedNever; the test passes at onceWhether an external object cache is in use
    MultisiteAlways, for every networkWhether the install is a network
    Autoloaded options, countMore than 500Options WordPress loads on every request
    Autoloaded options, sizeMore than 100,000 bytesThe same options, serialized
    Comments table1,000 rows or moreEstimated rows, including spam and trash
    Options table1,000 rows or moreEstimated rows, including transients
    Posts table1,000 rows or moreEstimated rows of all sixteen core content types
    Terms table1,000 rows or moreEstimated rows of categories, tags and more
    Users table1,000 rows or moreEstimated rows of every account
    The AHosting Persistent Object Cache Threshold Map — the checks WordPress 7.1.2 runs before printing You should use a persistent object cache, read from core source. Any single row in the recommendation column is enough on its own, and the test stops at the first one it meets.

    A Size Test, Not a Speed Test

    Every limit in that table is a count. None of them asks how long your pages take, how busy the server is, or how many of your visitors are logged in, which is the question that actually decides whether a persistent object cache would help. Core treats a large database as a proxy for a busy one. Often that holds. On small sites with long histories it frequently does not, and that is why so many people see this notice on sites nobody would call large. The two autoload limits are the same ones we traced in the guide to the autoloaded options warning, which fires from a separate test with its own, larger threshold.

    How Site Health decides you should use a persistent object cache The persistent object cache test is registered only when the environment type is production. If an object cache drop-in is already loaded, the result is good. If a filter has decided the answer, that answer is used. A multisite network always receives the recommendation. Otherwise the test counts autoloaded options and their serialized size, then reads estimated row counts for the comments, options, posts, terms and users tables. If more than 500 options are autoloaded, if they exceed 100,000 bytes, or if any of the five tables has 1,000 rows or more, the result is the recommendation You should use a persistent object cache. If none of the limits is reached, the result is good and reads A persistent object cache is not required. It measures size, never speed. What the Site Health persistent object cache test checks, in the order it checks it. 1. Production only A staging or development site never runs this test at all 2. Cache already in use? A loaded drop-in file passes the test before anything is counted 3. Multisite? Every network is told to use one, whatever its size 4. Autoloaded options More than 500 of them More than 100,000 bytes serialized Either one is enough to trigger the recommendation 5. Five tables, 1,000 rows posts, comments, options, terms or users Row counts are database estimates, not exact counts Any one of the seven limits prints the recommendation. None of them asks how fast your site is, or how many people are visiting it.

    Why a Small Site Trips the Persistent Object Cache Check

    The row limit sounds generous until you look at what lives in each table. The posts table in particular is not a list of your articles. It is where WordPress keeps almost every kind of content it has, and several of those kinds grow without anyone deciding to create them.

    The Posts Table Holds Sixteen Kinds of Content

    Stored in the posts tableHow it growsVisible to a visitor
    Posts and pagesEach one you publish or draftYes, once published
    RevisionsA new row on every save; unlimited by defaultNo
    AttachmentsOne row per file in the media libraryPartly
    Menu items and navigation menusOne row per menu linkNo
    Templates, template parts and global stylesCreated by block themes and the site editorNo
    Reusable blocks and patternsOne row per saved patternNo
    Cached embedsOne row per embedded URL that WordPress has fetchedNo
    Custom CSS, font families, font faces, changesets, privacy requestsAs those features are usedNo
    The sixteen content types WordPress 7.1.2 registers in the posts table, grouped. Plugins add their own, and a store or form plugin can add far more rows than the articles themselves.

    Revisions Are the Usual Reason

    WordPress keeps every revision unless you tell it otherwise, because the default for the revisions setting is simply true. The arithmetic is quick. A blog with 150 articles that were each saved six times holds 150 posts and 900 revisions, which is 1,050 rows before a single image is counted. Nobody would call that site large, and it meets the posts limit. We covered how to cap and clear revisions safely in the guide to limiting WordPress post revisions.

    The Row Count Is an Estimate

    Core does not count the rows. To stay fast, it reads the TABLE_ROWS figure from the database catalog, and the MariaDB reference for that catalog table notes that engines such as InnoDB may store an estimate there. A comment in the WordPress source says the same and calls it accurate enough. Usually it is, but after a large cleanup the estimate can lag behind the real count until the table statistics are refreshed. That is why the notice sometimes survives a cleanup that should have cleared it.

    What Your Host Appears to Support Redis Means for a Persistent Object Cache

    When the recommendation appears, it may carry one more sentence: Your host appears to support the following object caching services, followed by one or more names. People read this as confirmation that a persistent object cache is waiting to be switched on. It is not that, and the reason is visible in the source.

    The Check Asks PHP, Not the Server

    WordPress builds that list by asking PHP whether five extensions are loaded: APCu, Redis, Relay, Memcache and Memcached. It calls the PHP extension_loaded function for each name, and that is the entire check. A loaded Redis extension is a client library, the code PHP would use to talk to a Redis server. It says nothing about whether such a server is running, whether it is sized for your site, or whether your account is allowed to use it.

    Three Kinds of Name on That List

    Redis, Memcache and Memcached name client libraries for separate cache servers, so each one needs a server as well as the library. APCu is different: it keeps data inside PHP’s own memory rather than in a server you connect to, and whether that memory survives between requests depends on how the host runs PHP. Relay describes itself as both a Redis client and a shared in-memory cache, so it still expects a Redis server behind it. A host can install any of these for its own reasons on a server where no cache service is offered to customers. On some of our own shared servers the Redis client library is installed and no Redis service is sold, so Site Health on those servers may name Redis. Treat the list as a question to ask, never as the answer.

    Can You Run a Persistent Object Cache on Shared Hosting

    This is the question most guides to the notice skip, and it is the one that decides what you can actually do. The answer depends entirely on whether your host runs a cache server that your account is allowed to use, and most shared hosting does not.

    Our Answer, Checked on Our Own Servers

    On AHosting, the answer is no. None of our shared hosting plans or WordPress plans includes a persistent object cache, and we would rather say so here than let the notice imply otherwise. Before writing this guide we checked our shared servers directly, on 10 September 2026: none of them offered Redis or Memcached to customer accounts as a service. An object cache on AHosting means a VPS, where you have root access and run the cache server for your own site.

    Why Installing a Plugin Does Nothing on Its Own

    Object cache plugins for Redis or Memcached do one job: they install the drop-in file and point it at a server. Install one on a plan with no cache server and there is nowhere for the data to go. Depending on the plugin, the site either carries on without a persistent object cache or reports that it cannot connect. Neither result makes the site faster, and the notice stays.

    Never Borrow a Cache Server You Did Not Set Up

    One warning belongs in every guide to this notice. If a plugin finds a cache server on the machine and connects to it, check who that server belongs to before you rely on it. A cache server shared between accounts, without its own credentials for each site, means your data and other sites’ data are written into the same place. A persistent object cache you use should be one your host provisions for you, or one you run yourself.

    Does Your Site Actually Need a Persistent Object Cache

    Set the notice aside and ask a different question: how many of your requests reach PHP and the database at all? An object cache only speeds up the requests that do. If most of your visits are served from a page cache, it has very little to work with.

    The Page Cache Comes First

    A page cache stores the finished HTML of a page and hands it to the next anonymous visitor without starting WordPress. A persistent object cache stores the pieces WordPress uses while building a page, so it only helps when WordPress runs. The two are separate Site Health tests with separate notices, and we covered the other one in the guide to the page cache is not detected notice. On our WordPress plans pages are served by LiteSpeed with LSCache, and a page served from LSCache consumes no PHP process at all.

    Traffic an Object Cache Helps

    • Logged-in members, subscribers and students, whose pages are built for them and not served from a page cache.
    • Store carts, checkouts and account pages, which change for every customer.
    • A busy admin, with several editors saving and previewing at once.
    • Heavy REST API or search traffic, where each request runs fresh queries.

    If your site does little of this, a persistent object cache would save a few database lookups on requests that were already quick. If it does a lot, the notice is pointing at a real opportunity, whatever the reason it fired. Stores are the common case, which is why our WooCommerce plans start from a larger allocation: carts and checkouts can never be served from a page cache.

    How to Measure It Before Deciding

    The free Query Monitor plugin shows, on any page, how many database queries it took and whether an external object cache is in use; without one, it reports that an external object cache is not in use. Load a few of your slowest logged-in pages with it active. A page that runs hundreds of queries and repeats many of them is a candidate. A page that runs a few dozen fast ones is not.

    How to Clear the Persistent Object Cache Notice Honestly

    There are three honest outcomes, and only one of them involves a cache server. Start by finding out which limit fired, because the right move depends entirely on that.

    Find Which Limit Fired

    Open phpMyAdmin from your hosting control panel, select the site database, and run SELECT TABLE_NAME, TABLE_ROWS FROM information_schema.TABLES WHERE TABLE_SCHEMA = DATABASE(); to see the same estimates Site Health reads. Then run SELECT post_type, COUNT(*) FROM wp_posts GROUP BY post_type ORDER BY 2 DESC; to see what fills the posts table, adjusting the table prefix if yours is not wp_. Enter the results in the checker below.

    Persistent Object Cache Threshold Checker

    Enter the counts from the queries above. This applies the WordPress 7.1.2 limits and tells you which one fires first.

    —

    Tripped by:

    Do this first:

    This mirrors the default limits and cannot see your site. A plugin or host can change the limits through a filter, and the table counts Site Health reads are estimates.

    Three Ways to Resolve It

    OptionWhat it changesChoose it when
    Reduce the countsCaps and clears revisions, spam, expired transients and unused autoloaded options, then refreshes the table statisticsA limit fired because of history the site no longer needs
    Record the decision in codeTells Site Health you have decided the recommendation does not applyYour traffic is mostly cached, you have measured, and no cache server is available
    Add a real cache serverRuns Redis or Memcached for your site and installs a drop-in that connects to itMuch of your traffic reaches PHP and your pages repeat queries
    Three honest ways to resolve You should use a persistent object cache. Installing a plugin with no server behind it is not on the list, because it changes nothing.

    Reducing the Counts

    For the posts table, cap revisions and clear the old ones; for the comments table, empty spam and trash; for the options table, clear expired transients and remove options left behind by deleted plugins. Then refresh the estimate, because the catalog figure may not move on its own straight away. In phpMyAdmin, the table’s Operations tab offers Analyze table, which refreshes the statistics the estimate comes from.

    Recording the Decision in Code

    Core provides a filter for sites that have weighed the recommendation and decided against it. A one-line must-use plugin containing add_filter( 'site_status_should_suggest_persistent_object_cache', '__return_false' ); makes the test report that a persistent object cache is not required. Use it only after the measurement above. It changes the notice, not the site, and it hides the notice on a day your traffic grows into it.

    When a Persistent Object Cache Is Worth Moving For

    If the measurement says your slow pages are the logged-in, cart or admin kind, and they repeat the same queries, then the notice is right about your site even if it fired for the wrong reason. The fix at that point is a cache server that belongs to you, sized for the site, with a drop-in connecting WordPress to it.

    Where the Work Stops Being Yours

    That is the part we take off your hands. An AHosting VPS is a KVM virtual machine with guaranteed CPU and memory and full root access, so you can run Redis or Memcached for your site alone rather than hoping a shared server offers one. Everything before this point, the counts, the revisions and the measurement, is yours to check, and this guide covers all of it. If you are weighing the move for other reasons too, our guide to the signs a WordPress site has outgrown shared hosting covers the rest of the decision.

    A Short Checklist

    1. Read the notice as a size warning. Nothing in it measures speed.
    2. Run the two queries above and find which of the seven limits fired.
    3. If it is revisions, spam or stale options, clean them up and refresh the table statistics.
    4. Measure your slowest logged-in pages before deciding a cache server is worth having.
    5. Never point a plugin at a cache server that you did not set up and that is not yours alone.
    6. If the traffic justifies it, run a persistent object cache on a server that is yours.

    Frequently Asked Questions About the Persistent Object Cache Notice

    Is the persistent object cache warning in Site Health necessary to fix?

    In practice it is a recommendation, not a fault, and many sites can leave it. Site Health shows it when a database table or the set of autoloaded options crosses a fixed size, not when anything is slow or broken. So the first question is whether your site sends much traffic that a page cache cannot serve, such as logged-in members, carts or a busy admin. If most visitors are anonymous and your pages are cached, the benefit of an object cache is small and the notice can wait.

    Why does Site Health say I should use a persistent object cache in 2026?

    Specifically because one of seven counters crossed its line. Every multisite network gets the notice. On a single site it appears when more than 500 options are autoloaded, when those options exceed 100,000 bytes, or when the posts, comments, options, terms or users table reaches 1,000 rows. The test has worked this way since WordPress 6.1 and is unchanged in 7.1.2. It measures size, never speed, and it only runs on sites whose environment type is production.

    Can I use a persistent object cache on AHosting shared or WordPress hosting?

    That said, the honest answer is no. A persistent object cache needs a cache server such as Redis or Memcached that your site connects to, and none of the AHosting shared or WordPress plans includes one. We checked our shared servers directly before writing this. A plugin on its own cannot supply the server. If your site genuinely needs one, it means a VPS where you have root access and can run the cache server yourself, and the rest of this guide explains how to tell whether it does.

    Persistent object cache vs page cache: which one does my WordPress site need?

    Typically the page cache first, because it helps more visitors for less effort. A page cache stores the finished HTML, so an anonymous visitor is served without WordPress running at all. An object cache stores the results of database lookups between requests, so WordPress runs faster when it has to run. Sites with mostly anonymous traffic get most of their gain from the page cache. Membership sites, stores and busy editorial teams send traffic a page cache cannot serve, and that is where an object cache earns its place.

    Redis vs Memcached for a WordPress persistent object cache: does the choice matter?

    Typically much less than people expect. Both are in-memory servers that WordPress reaches through a drop-in file and a plugin that provides it, and either one removes the repeated database lookups the notice is about. Redis can also write its data to disk and supports richer data types, which some teams want for other reasons. For a WordPress object cache the decision that matters more is having a server that is yours alone, sized for the site, and a well maintained plugin.

    Why does my small blog trigger the persistent object cache recommendation?

    In particular because the posts table is not a count of your posts. WordPress stores sixteen kinds of content in that one table, including every saved revision, every image and file in the media library, menu items, templates and cached embeds. Revisions are unlimited by default. A blog with a modest number of articles can therefore pass 1,000 rows without anyone noticing, and the count the test reads is an estimate from the database rather than an exact figure.

    Does installing a Redis plugin clear the warning on shared hosting in 2026?

    In fact not by itself, because the plugin is only a connector. It installs a drop-in file that tells WordPress to keep its cache in Redis, and it needs a Redis server to connect to. Without one there is nothing to store data in. Never point a plugin at a cache server that you did not set up and that is not yours alone, because a shared cache means your site and other sites write into the same place. Ask your host what is actually provisioned first.

    What does your host appears to support Redis mean in Site Health?

    Notably it means less than it sounds. WordPress checks whether PHP has loaded the client library for APCu, Redis, Relay, Memcache or Memcached, and names each one it finds. It never checks whether a cache server is running or whether your account may use one. A host can install a client library for its own reasons on a server where no cache service is offered to customers. Treat the line as a clue to ask about, not as confirmation that a cache is available to you.

    When is it worth moving to an AHosting VPS for a persistent object cache in 2026?

    Ultimately when your slow requests are ones a page cache cannot serve. Logged-in members, WooCommerce carts and checkouts, a busy admin and heavy REST traffic all reach PHP and the database on every request, and those are what an object cache speeds up. An AHosting VPS gives you root access, so you can run Redis or Memcached for your site alone. If your traffic is mostly anonymous and cached, a VPS for this reason alone is money spent on a notice rather than on speed.

    Does AHosting LiteSpeed caching replace the need for an object cache?

    Indeed for anonymous visitors it covers most of the same ground, and it is worth being clear about where it stops. AHosting WordPress plans run LiteSpeed with LSCache, and a page served from LSCache never starts PHP, so it needs no object cache at all. A logged-in session is not served from the page cache, so those requests still reach PHP and the database. If most of your visitors are logged in, the page cache helps them little and the notice deserves a closer look.
    September 25, 2026
  • The Server Cannot Process the Image: What WordPress Is Telling You

    The Server Cannot Process the Image: What WordPress Is Telling You

    • What The Server Cannot Process the Image Actually Means
      • The Upload Worked. The Resizing Did Not.
      • Three Wordings for One Failure
    • What WordPress Does After the Server Cannot Process the Image
      • A Header That Carries the Media Entry Number
      • Five Retries, Then the Upload Is Deleted
    • Why the Server Cannot Process the Image in One Screen but Not Another
      • The Conditions for In-Browser Resizing
      • A Console Line That Tells You Which Path Ran
    • The Memory Bill of One Photo Upload
      • What We Measured
      • Why Your Error Log May Say Nothing
    • Which Limit Stops the Server From Processing the Image
      • PHP Memory, and the 256 MB WordPress Already Asks For
      • The Account Memory Cap
      • The Clock
    • How to Fix The Server Cannot Process the Image, in Order
      • Seven Steps When the Server Cannot Process the Image
      • Fixes by What You Found
    • When the Fix Is More Headroom
      • Where the Work Stops Being Yours
    • Frequently Asked Questions About The Server Cannot Process the Image
      • How do I fix the server cannot process the image error in WordPress?
      • Why does WordPress say the server cannot process the image for ordinary photos in 2026?
      • Is my photo still uploaded when the server cannot process the image?
      • Does AHosting WordPress hosting have enough memory to avoid the server cannot process the image?
      • GD vs Imagick: which image library fails less often with large photo uploads?
      • Block editor vs Media Library: why does only one of them show this upload error?
      • Will an AHosting plan upgrade fix the server cannot process the image in 2026?
      • Can I raise the memory limit myself so large photo uploads stop failing?
      • How do I check which image library my AHosting WordPress site is using?
      • Does the server cannot process the image error affect SEO or page speed in 2026?
    TL;DR

    When WordPress says the server cannot process the image, the upload almost always worked. What failed is the resizing that follows, which unpacks every pixel of the photo into memory before making up to seven smaller copies. We measured that at about a quarter of a gigabyte for a 48 megapixel phone photo. Since WordPress 7.1 the block editor can do the resizing in your browser instead, while the Media Library still does it on the server, so the same photo can fail in one and work in the other. The fix depends on which limit stopped the resize, and your error log usually says which.

    What The Server Cannot Process the Image Actually Means

    When WordPress tells you the server cannot process the image, it is describing the second half of an upload, not the first. The file reached your site. WordPress saved it and created its media library entry before it did anything else. Then it began making the smaller copies every theme and page builder asks for, and somewhere in that work the request ended in a server error. The message is what the uploader prints when that happens. It is a guess about the cause, and the guess is often right: a busy server, or one without enough resources for the job it was just given.

    Listen: when WordPress says the server cannot process the image, the upload usually worked and the resizing did not, and what is left in the media library tells you which limit it hit. By Matt Chrust, Director of Business Development, AHosting.

    The Upload Worked. The Resizing Did Not.

    This distinction decides everything that follows. A failed upload means the file never arrived, which is a question of file size limits and is covered in our guide to the link you followed has expired. A failed resize means the file arrived and the server then ran out of something while working on it. For a photo larger than 2560 pixels on its long edge, WordPress first makes a scaled copy at that size, then six more copies at the default sizes of 150, 300, 768, 1024, 1536 and 2048 pixels. That is seven images written from one upload, before any theme adds sizes of its own.

    Three Wordings for One Failure

    You may be searching for an older version of this message. WordPress 5.3 introduced it as Post-processing of the image failed, followed by advice to scale a large photo down. Versions 5.4 to 5.8 said Post-processing of the image failed likely because the server is busy or does not have enough resources. Since 5.9 the wording has been The server cannot process the image. This can happen if the server is busy or does not have enough resources to complete the task. Uploading a smaller image may help. Suggested maximum size is 2560 pixels. All three come from the same code path, and everything below applies to each of them.

    What WordPress Does After the Server Cannot Process the Image

    Most guides stop at the message. The code behind it is more useful, because it explains two things people report and cannot account for: photos that appear in the library and then disappear, and failures that happen instantly with no attempt to recover. Both are deliberate, and both are visible if you know where to look.

    A Header That Carries the Media Entry Number

    Just before WordPress starts resizing, it sends a response header named X-WP-Upload-Attachment-ID carrying the number of the media entry it has just created. The core source comments explain why: it lets the browser resume creating the resized copies after a fatal PHP error. If resizing then crashes the request, the error response still carries that header, and the uploader in your browser knows exactly which entry was left half finished.

    Five Retries, Then the Upload Is Deleted

    In the Media Library uploader, both the Add New screen and the media window inside the editor, a server error in the 500 range with that header present starts a recovery loop. The browser asks the server to create only the missing copies, and if that request fails too, it asks again, up to five times. Should any attempt succeed, the upload completes as if nothing happened. If all five fail, the browser sends one last request asking the server to delete the entry and its files, which the server does only if the entry is less than ten minutes old and you are allowed to delete it. Then the error appears. That is the photo that was there a moment ago.

    When the header is missing, there is no loop at all. WordPress holds its headers until it replies, so a PHP process stopped from outside never sends one, and neither does an error page from a proxy, a firewall rule or the web server. So what is left in your library is a diagnosis. A photo that vanished after retries points at a PHP error, which the error log will name. A photo that stayed without its thumbnails points outside PHP.

    What happens after the server cannot process the image Step one, the photo arrives and WordPress saves the original file and creates its media library entry. Step two, WordPress starts making the resized copies and the request ends in a server error in the 500 range. Step three, if the response carried the X-WP-Upload-Attachment-ID header, the browser asks the server to create the missing copies again, up to five times. If one attempt succeeds, the upload completes normally. If all five fail, the browser asks the server to delete the entry and its files, which it does only if the entry is less than ten minutes old, and the error message is shown. If the header was missing, because the PHP process was stopped from outside or something other than WordPress answered, the browser shows the error with no retries, and the original stays without its resized copies. The upload worked. The resizing did not. What the Media Library uploader does in WordPress 7.1 when resizing fails. 1. Original saved File written to uploads and a media entry created first 2. Resizing fails Memory, a process cap or the clock ends it with a 5xx 3. Entry ID read The browser looks for the X-WP-Upload-Attachment-ID header Header present Up to 5 more requests to finish the resized copies All 5 fail: entry deleted if under 10 minutes old, then the error is shown Header missing The process was stopped from outside, or a proxy or security rule answered No retries: the original stays without its resized copies After five failures, the original is deleted along with its entry. The block editor in 7.1 uses a different queue and can resize in the browser instead.

    Why the Server Cannot Process the Image in One Screen but Not Another

    WordPress 7.1 added something no current guide to this error mentions, and it changes the diagnosis. The block editor can now do the resizing in your browser, using a WebAssembly build of the libvips image library running in a background worker. When it does, the server receives copies that are already the right sizes and never decodes the full photo. The Media Library uploader has not changed: it still sends the original and resizes on the server. So the same photo, on the same site, can fail from Media and upload cleanly from the editor.

    The Conditions for In-Browser Resizing

    In-browser resizing is switched on only when every condition below is met. Most of them are decided by your browser or your connection to the site, which is why two people on the same site can see different results. The table is read from the WordPress 7.1.2 source.

    ConditionWhy it mattersIf it is not met
    The dashboard is served over HTTPSWordPress checks this on the server before offering the feature at allServer-side resizing for everyone
    A Chromium browser from version 137WordPress sends the Document-Isolation-Policy header only to Chrome, Edge and other Chromium browsers at 137 or laterNo isolation, so the next check fails
    The page is cross-origin isolatedThe resizer needs shared memory between threads, which browsers allow only on isolated pagesServer-side resizing
    At least 2 CPU cores and more than 2 GB of device memoryThe editor checks the device before starting the resizerServer-side resizing
    Data saver is off and the connection is faster than 2GThe resizer downloads a large WebAssembly moduleServer-side resizing
    The Content Security Policy allows blob: workersThe resizer runs in a worker created from a blob, which a strict worker-src rule blocksServer-side resizing
    A standard editor screenPage builders that replace the editor screen are skipped on purposeServer-side resizing
    When WordPress 7.1 resizes uploads in the browser instead of on the server. Every row must pass; a single failure sends the original photo to the server, where the error can occur.

    A Console Line That Tells You Which Path Ran

    You do not have to guess which path an upload took. Open the block editor, open your browser’s developer console, and upload an image. If the browser could not do the work, the editor logs a line beginning Client-side media processing unavailable, followed by the reason and the words Using server-side processing. The reason is precise. The most common one names the missing shared memory feature, which on current browser support tables is available only on isolated pages. Safari and Firefox users will usually see it, because WordPress sends its isolation header only to Chromium. No line means the browser did the resizing.

    One consequence is worth stating plainly: switching to Chrome is a legitimate workaround when the server cannot process the image, not a superstition. It moves the heavy work off the server entirely. The header WordPress sends is defined in the Document Isolation Policy specification, and a proxy that strips unfamiliar response headers from the dashboard will quietly turn the feature off for everyone.

    The Memory Bill of One Photo Upload

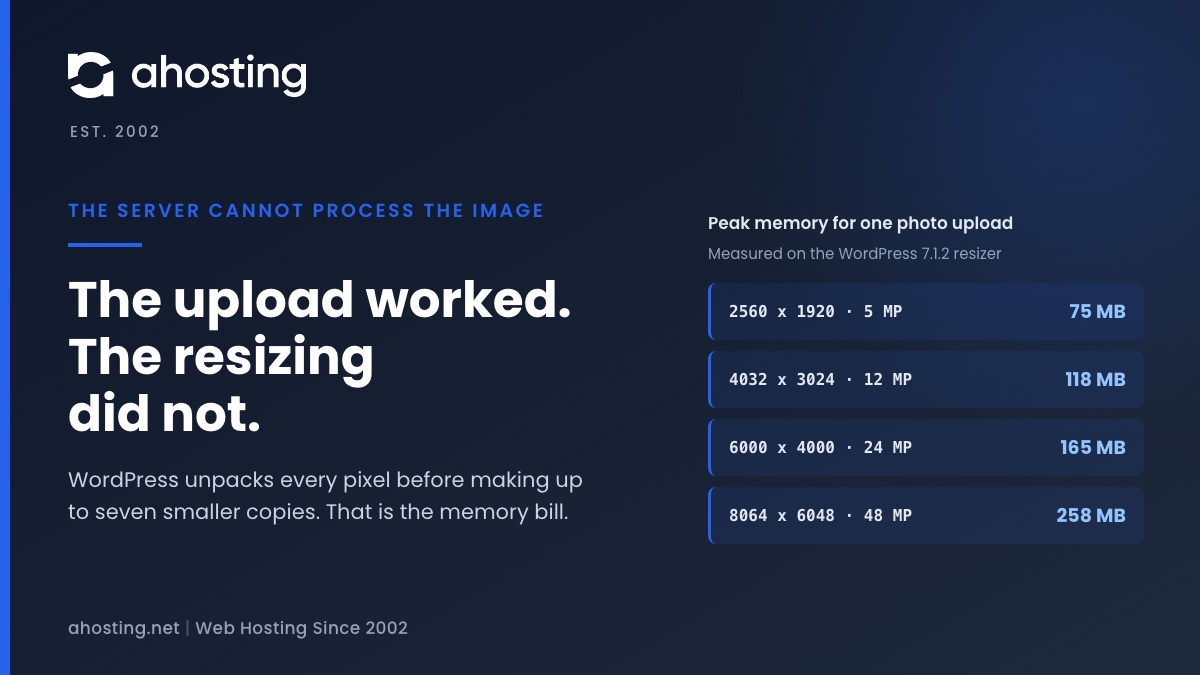
    The size of the file you upload tells you very little about the work it causes. A JPEG is compressed; to resize it, the image library has to decompress every pixel into memory first. A 12 megapixel phone photo that is a few megabytes on disk becomes tens of megabytes once decoded, and that decoded copy stays in memory while the smaller ones are made. To see why the server cannot process the image, we measured it rather than repeat a rule of thumb.

    What We Measured

    We ran the WordPress 7.1.2 GD image editor, the real class from core rather than a reconstruction, through the exact sequence core follows for an upload: load the original, scale it to 2560 pixels, save it, reload the scaled copy and make the six default sizes. Each photo size ran three times on PHP 8.5, and we recorded the peak memory the whole PHP process used, which is the figure an account memory cap counts. PHP alone started at about 25 MB.

    PhotoMegapixelsDecoded originalImage data PHP must holdMeasured process peak
    2560 x 19204.919 MBabout 31 MB75 MB
    4032 x 3024, a common phone camera12.247 MBabout 65 MB117 to 118 MB
    6000 x 4000, a common DSLR24.092 MBabout 108 MB149 to 165 MB
    8064 x 6048, a 48 MP phone mode48.8186 MBabout 205 MB237 to 258 MB
    The AHosting Photo Upload Memory Ladder — peak memory for one upload through the WordPress 7.1.2 GD resizer, measured on 23 September 2026 at three runs per size. Image data is the decoded original plus the largest copy held beside it, at four bytes per pixel. Imagick was not measured and uses memory differently.

    The ladder rises with pixel count, not with file size, and the top rung is the one that matters now that phones save 48 megapixel photos. Roughly a quarter of a gigabyte for one upload, before WordPress and your plugins add their own share of the same request.

    Why Your Error Log May Say Nothing

    Here is why the server cannot process the image with nothing in the error log. Whether that image memory counts against PHP’s memory limit depends on how PHP was built. The copy of GD bundled with PHP routes every allocation through PHP’s own allocator, as the PHP source defines it, so it counts, and running out leaves an Allowed memory size exhausted line in the error log. A PHP built against an external GD does not count it, and neither does Imagick, which manages its own memory under ImageMagick resource limits and can spill large images to disk. In those builds PHP never objects. The process can still be stopped by the account memory cap, and then the log is silent.

    Which Limit Stops the Server From Processing the Image

    When the server cannot process the image, one of three separate limits ended the resize, and each leaves a different trace. Finding the right one first saves you from raising a setting that was never the problem, which is the most common wasted fix for this error.

    PHP Memory, and the 256 MB WordPress Already Asks For

    WordPress raises PHP’s memory limit on its own before any image work, to the value of WP_MAX_MEMORY_LIMIT. That constant defaults to 256 MB, or to your PHP limit if that is already higher, and the raise only works where the host lets PHP change the setting at runtime. So raising your PHP limit from 128 MB to 256 MB does nothing for images, a mistake we see often. A PHP limit above 256 MB is adopted automatically, and defining the constant higher in wp-config.php is the alternative. Our guide to WordPress memory limit errors covers where each one is set.

    The Account Memory Cap

    On shared hosting, every PHP process on your account draws from one memory allowance, whatever limit each process was given. A single 48 megapixel upload fits easily. Five of them dropped into the uploader together, a gallery plugin regenerating thumbnails in the background, and a busy front end can add up to more than the account allows, and the process that tips it over is stopped before it can reply, so no retries follow. A request refused for too many simultaneous processes arrives as a 508, which we explained in the guide to 508 resource limit errors. The uploader shows this same message for it, even though that photo never reached WordPress at all.

    The Clock

    Sometimes the server cannot process the image because it ran out of time. Resizing a very large photo on a busy shared processor is slow, and two clocks are running. PHP stops a script that exceeds its maximum execution time, and any proxy in front of the server gives up after its own timeout and returns an error page of its own. The first is a PHP error, so the retries run, and because each retry makes only the copies still missing, a timeout often clears on a later attempt. The second carries no header and is never retried. Our resource limit diagnostic tree walks through telling these apart from the account usage graphs.

    How to Fix The Server Cannot Process the Image, in Order

    Work through these in order whenever the server cannot process the image. The early steps take a minute each and tell you which of the later ones you need, so skipping ahead usually means changing a setting that was not the limit.

    Photo Upload Memory Check

    Pick the photo size, the image library and the memory WordPress may use for images. This uses the figures we measured running the WordPress 7.1.2 resizer on four photo sizes, so you can see which limit a server-side upload is closest to.

    —

    Measured peak:

    Which limit sees it:

    Do this first:

    Peaks were measured on a workstation with only the WordPress image editor loaded. A real dashboard request also carries WordPress and your plugins, so treat a result marked tight as a likely failure.

    Seven Steps When the Server Cannot Process the Image

    1. Check the media library before retrying. A photo that stayed without thumbnails means no retries ran, because the process was stopped from outside PHP or something else answered. One that appeared and then vanished was deleted after five failed retries.
    2. Read the PHP error log from the time of the upload. An Allowed memory size line means PHP memory. A log with nothing in it points at the account cap, a process limit or a timeout.
    3. Try the same photo from the block editor in Chrome. If it succeeds there and fails in Media, the server was the limit, and in-browser resizing is a working route around it.
    4. Scale the photo to 2560 pixels on its long edge before uploading. WordPress would make that copy anyway, and it removes most of the memory bill.
    5. If you need full-size originals, raise the PHP memory limit above 256 MB, within your plan’s ceiling. WordPress uses any higher PHP limit for images without further changes.
    6. Remove image sizes nobody uses. Every size a theme or plugin registers is another copy made from the decoded original on every upload.
    7. Rebuild any copies that were never made with the WP-CLI media regenerate command and its only-missing option.

    Fixes by What You Found

    What you foundLikely limitFixWhat not to do
    Allowed memory size exhausted in the error logPHP memory for the requestRaise the PHP limit above 256 MB, or pre-scale the photoRaise the PHP limit to exactly 256 MB, which WordPress already uses
    Maximum execution time exceeded in the error logThe PHP time limitPre-scale the photo, or retry once, since each retry makes only missing copiesRaise the memory limit for a time problem
    Photo stayed without thumbnails, log silentAccount memory cap, a process limit, or a proxy answeredUpload one photo at a time, then check the resource usage page and proxy logsKeep retrying the same batch
    Works in the block editor, fails in MediaServer-side resizing onlyUpload from the editor, or pre-scale for MediaTreat the site as broken
    Fails only on very large originalsThe threshold is disabled or raisedRestore the default through the big_image_size_threshold filterDisable the threshold on shared hosting
    Fixes for the server cannot process the image, by what the first two steps showed. The last column matters as much as the fix: each entry in it either changes nothing or makes the next upload heavier.

    When the Fix Is More Headroom

    Most sites never need a bigger plan when the server cannot process the image. A photo scaled to 2560 pixels needs less than a third of the memory of a 48 megapixel original, and the block editor can now do the work in the browser. The plan starts to matter when full-resolution originals are part of the job, as they are for photographers and for stores that zoom product images, or when several people upload at once. Before changing anything, confirm which library WordPress is using, as our guide to recommended modules that are missing explains.

    Where the Work Stops Being Yours

    What we take off your hands is the ceiling. Every one of our WordPress plans publishes a PHP memory limit of up to 512 MB, twice what WordPress asks for by default, inside an account allowance of 2, 3 or 4 GB, so a full-size 48 megapixel photo resizes on the server with room to spare once the limit is raised. The account allowance is shared by every site on it, which is why the WooCommerce plans suit stores uploading large product galleries. For sites that are not WordPress, our web hosting plans carry the same PHP limit, and a site processing images all day belongs on a VPS with memory of its own.

    Frequently Asked Questions About The Server Cannot Process the Image

    How do I fix the server cannot process the image error in WordPress?

    Typically by finding out which limit the resize ran into rather than by retrying the same file. The upload itself usually succeeded, so first check the media library. A photo that stayed without its thumbnails points outside PHP, and one that vanished after a pause was deleted by WordPress after five failed retries. Then read the PHP error log for an allowed memory size line. If one is there, the image needs more PHP memory than the request was allowed. If the log is silent, the process was stopped from outside PHP, by the account memory cap or a timeout. Shrinking the photo to 2560 pixels on its long edge before uploading fixes either case.

    Why does WordPress say the server cannot process the image for ordinary photos in 2026?

    Specifically because ordinary photos are now very large once decoded. A current phone camera can save a 48 megapixel image, and while the file on disk may be only a few megabytes, the resizer has to unpack every pixel into memory before it can shrink it. In our measurement that single step took a quarter of a gigabyte for a 48 megapixel photo. WordPress then makes up to seven resized copies from it. The error is the message WordPress shows when the server gave up partway through that work.

    Is my photo still uploaded when the server cannot process the image?

    In practice it arrives, but it may not stay. WordPress saves the file and creates its media library entry before it starts resizing, and it reports the entry number back to the browser in a response header for exactly this situation. The Media Library uploader then asks the server five more times to finish the resized copies. If every attempt fails, it asks the server to delete the entry and its files, which is why a photo can appear briefly and then vanish. When no retries ran, the original usually remains without its copies.

    Does AHosting WordPress hosting have enough memory to avoid the server cannot process the image?

    That said, memory is only one of the limits involved, so it is worth being precise. AHosting WordPress plans publish a PHP memory limit of up to 512 MB and account memory of 2, 3 or 4 GB depending on the plan. In our measurement a 48 megapixel photo peaked at about a quarter of a gigabyte during resizing, which fits comfortably inside both once the PHP limit is set above 256 MB. What can still fail is several large uploads at once, because every site on the account shares the same memory cap, and a timeout on a very slow resize.

    GD vs Imagick: which image library fails less often with large photo uploads?

    By contrast with the usual advice, neither is simply safer, because they fail in different places. GD, when PHP was built with its bundled copy, counts every decoded pixel against the PHP memory limit, so it fails early and leaves an allowed memory size line in the error log. Imagick allocates outside that limit, so PHP never objects, but the process still counts against the account memory cap and can be stopped there without any PHP error at all. The library that fails less is the one whose limit has more room.

    Block editor vs Media Library: why does only one of them show this upload error?

    Notably WordPress 7.1 changed where resizing happens. On a site served over HTTPS, in a browser that allows it, the block editor now resizes images inside the browser and sends the finished copies to the server, so the server never has to decode the full photo. The Media Library uploader still sends the original and resizes on the server. So the same photo can fail from Media and succeed from the editor. The browser console in the editor prints a line saying which path it used.

    Will an AHosting plan upgrade fix the server cannot process the image in 2026?

    Ultimately only if the limit you hit belongs to the plan, and the error log tells you whether it does. A larger plan raises the account memory cap and the number of processes that can run at once, which helps when several large uploads or a busy site share the account. It does not help when the PHP memory limit is set below what one photo needs, because that is a setting you can raise yourself within the published ceiling. Check that setting first, and upgrade only when the account cap is the proven limit.

    Can I raise the memory limit myself so large photo uploads stop failing?

    Indeed you usually can, and it helps to know what WordPress already does. Before image work it raises the limit to the value of the WP_MAX_MEMORY_LIMIT constant, which is 256 MB unless your PHP limit is higher, so raising the PHP limit from 128 to 256 changes nothing for images. Set the PHP limit above 256 MB and WordPress adopts the higher figure on its own. Defining the constant in wp-config.php is the other route, where PHP may raise its own limit. Neither can exceed the account cap.

    How do I check which image library my AHosting WordPress site is using?

    Fortunately WordPress will tell you without any code. Open Tools, then Site Health, then the Info tab, and expand Media Handling. The Active editor line names the library WordPress picked, the GD version line shows whether GD is the bundled build, and when Imagick is loaded its resource limits are listed too. On an AHosting account the extension list for each PHP version is in Select PHP Version in cPanel, so turning Imagick on or off for the version you run is a checkbox.

    Does the server cannot process the image error affect SEO or page speed in 2026?

    Interestingly the error itself affects nothing visitors or crawlers see, because it only happens in the dashboard. What it affects is what you publish next. A photo that uploads without its resized copies, or one that is re-uploaded at full size to get around the error, can end up served to phones at many times the size they need, and oversized images are among the most common causes of a slow largest contentful paint. So fix the resize, not the symptom, and check that the resized copies exist.

    September 24, 2026
  • Page Cache Is Not Detected: What WordPress Site Health Actually Checks

    Page Cache Is Not Detected: What WordPress Site Health Actually Checks

    • What Page Cache Is Not Detected Actually Means
      • The Four Labels the Page Cache Test Can Print
      • Why Page Cache Is Not Detected Is a Recommendation, Not a Failure
    • How Site Health Decides That Page Cache Is Not Detected
      • Three Requests to Your Own Homepage
      • Sixteen Headers and One File
      • The Median, and Why One Slow Request Does Not Fail You
    • The Headers Site Health Accepts as Proof of a Page Cache
    • Why a Working Cache Still Shows Page Cache Is Not Detected
      • LiteSpeed Cache Stopped Writing the Drop-In File
      • A Custom Proxy Header Site Health Has Never Heard Of
      • The Homepage Is the One Page Not Being Cached
      • A Staging Copy Never Runs the Test at All
    • Why Site Health Can Report a Page Cache That Does Not Exist
      • Three Headers Count Just by Being Present
      • A Browser Cache Instruction Is Not a Page Cache
    • What Our Own Blog Returned When We Asked Three Times
      • A Miss, Then Two Hits
      • What Site Health Would Make of It
    • How to See Exactly What the Page Cache Test Saw
      • Repeat the Three Requests From a Terminal
      • Ask From Inside the Server
      • Read the Header Documentation for Your Layer
    • How to Fix Page Cache Is Not Detected on LiteSpeed, Nginx and Behind a CDN
      • Fixes by Stack When Page Cache Is Not Detected
      • Registering a Header the Test Does Not Know
      • When the Slow Half of the Message Is the Real Problem
    • A Practical Checklist for Page Cache Is Not Detected
      • Why a Page Cache Matters More on Shared Hosting
      • Where the Work Stops Being Yours
    • Frequently Asked Questions About Page Cache Is Not Detected
      • How do I fix page cache is not detected in WordPress Site Health?
      • Why does Site Health say page cache is not detected on a cached site in 2026?
      • Is page cache is not detected but the server response time is OK safe to ignore?
      • Does AHosting LiteSpeed hosting ever show page cache is not detected?
      • Page cache vs object cache: which one does this Site Health check actually measure?
      • LiteSpeed Cache vs a Cloudflare edge cache: which one does Site Health see?
      • Will an AHosting plan upgrade fix a slow page cache is not detected result in 2026?
      • Can I add my own cache header so the page cache check passes?
      • Does AHosting count cached pages against my entry process limit?
      • Does page cache is not detected affect SEO or Core Web Vitals in 2026?
    TL;DR

    Site Health decides whether you have a page cache by requesting your homepage three times from your own server and looking for a caching header, or for a cache drop-in file. It never looks at the cache itself. So the message can appear on a site that is cached perfectly well, and it can stay silent on a site with no cache at all. Response time alone decides whether the result is a recommendation or critical. Read the headers your homepage actually returns and you will know in a minute which of the two you have.

    What Page Cache Is Not Detected Actually Means

    When WordPress Site Health prints Page cache is not detected but the server response time is OK, it is reporting the outcome of one small experiment and nothing more. Your server fetched your own homepage three times, timed each answer, and looked through the response headers for a sign that a cache had served it. It found none. That is the whole finding. It is not a measurement of your cache, which the test never inspects, and it is not a verdict on your hosting. It is a statement about which headers came back.

    Listen: Site Health never looks at your cache, it reads three homepage responses for headers, so a working cache can go unseen and a site with no cache can pass. By Matt Chrust, Director of Business Development, AHosting.

    The Four Labels the Page Cache Test Can Print

    The same test produces four different headings, and people searching for one of them are usually looking at another. The difference matters, because two are recommendations and two are critical, and the thing that separates them is not the cache at all. It is the clock. The table below is read straight from the WordPress 7.1.2 source.

    Label Site Health printsStatusMedian response timeCache signal found
    Page cache is detected and the server response time is goodGoodUnder 600 msYes
    Page cache is not detected but the server response time is OKRecommendationUnder 600 msNo
    Page cache is detected but the server response time is still slowCritical600 ms or moreYes
    Page cache is not detected and the server response time is slowCritical600 ms or moreNo
    The four page cache results in WordPress Site Health. Speed decides the status column on its own; the cache signal only chooses between the two labels within each status. A fifth result, Unable to detect the presence of page cache, appears when a request fails outright.

    Why Page Cache Is Not Detected Is a Recommendation, Not a Failure

    Look at the second row again. A site can have no cache whatsoever and still land in the recommendation band, provided its homepage answers in under 600 milliseconds. And a site with a working cache lands in the critical band the moment its median crosses that line. So the common reading of this notice, that WordPress has found a problem with your cache, is backwards. It has found a fast site with no visible cache, and it is suggesting you add one before traffic makes the speed disappear.

    How Site Health Decides That Page Cache Is Not Detected

    Every guide to this message starts at the fix. Starting at the test is quicker, because the test is short, the rules are fixed, and once you know them you can predict the result without opening the dashboard. Three decisions produce every outcome: what gets requested, what counts as evidence, and which timing gets compared with the threshold.

    Three Requests to Your Own Homepage

    The test calls your own site address, the homepage and only the homepage, three times in a row from the server itself. Each request is sent with no login cookie, so it sees what an anonymous visitor sees rather than what you see in the dashboard. If any one of the three errors, or returns a status other than 200, the test stops at once and prints Unable to detect the presence of page cache, adding that loopback requests may be the problem. That wording is exact, and we covered what sits behind it in the guide to the loopback request error. A homepage that redirects to a login screen, or a maintenance page, ends the test here.

    Sixteen Headers and One File

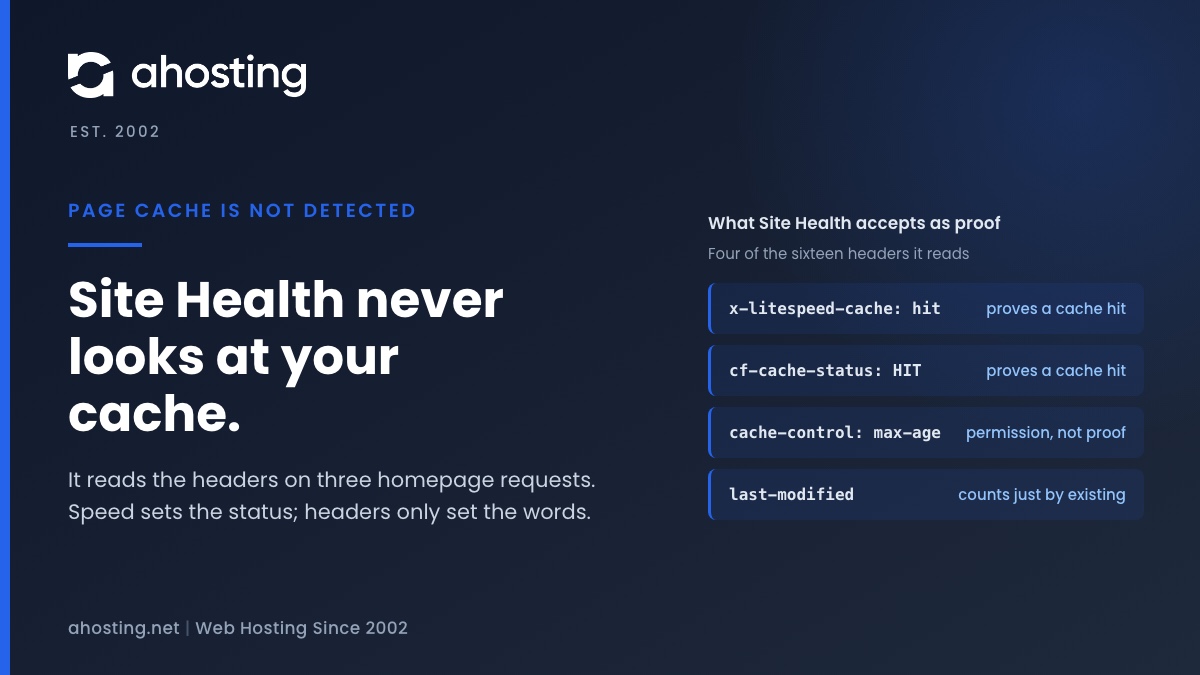
    For each of the three responses, WordPress walks a list of sixteen header names and records any that are present and pass their rule. Separately, it checks whether a file named advanced-cache.php exists in the content directory while caching is switched on in the configuration, which is the drop-in mechanism older cache plugins used to intercept requests. Either piece of evidence is enough. The headers from all three responses are merged into one set, so a single qualifying header on any single request counts as found for the whole test. That merge is why a cold cache usually still passes.

    The Median, and Why One Slow Request Does Not Fail You

    The three timings are sorted from slowest to fastest and the middle one is kept. One slow outlier, such as the first request warming an empty cache, is thrown away by construction. That middle value is then compared with 600 milliseconds, a default taken from the published guidance on time to first byte and adjustable through its own filter. The measured time includes the whole round trip from your server back to itself, connection and encryption setup included, so it is not purely the time PHP spent building the page.

    How Site Health decides a page cache is not detected The Site Health page cache test makes three requests to the site homepage from the server itself. If any request errors or returns a status other than 200, the result is Unable to detect the presence of page cache. Otherwise the three response times are sorted and the middle one is used. If that median is under 600 milliseconds and a caching header or a cache drop-in was found, the result is good. If it is under 600 milliseconds and nothing was found, the result is a recommendation reading Page cache is not detected but the server response time is OK. If the median is 600 milliseconds or more the result is critical whether or not a cache was found, and only the wording changes. Speed sets the status. Headers only set the words. What the Site Health page cache test does, in the order it does it. 1. Three requests Your server fetches your own homepage, logged out, 3 times 2. Any request fails? Error or not 200: the test stops and reports it is unable to detect 3. Take the median The middle of three timings is compared with 600 milliseconds Median under 600 ms Header or drop-in found: good Nothing found: recommendation “Page cache is not detected but the server response time is OK” Median 600 ms or more Critical either way Found: “detected but still slow” Nothing found: “not detected and the server response time is slow” One HIT header on any of the three requests is enough to count as found. So is a Last-Modified header, which proves nothing about caching at all.

    The Headers Site Health Accepts as Proof of a Page Cache

    Not every header on the list is judged the same way. Some must carry a particular value, and a few count simply by existing. Knowing which is which explains most of the confusing results people report, in both directions. The table is the list as it ships in WordPress 7.1.2, grouped by the rule applied, with the software that typically sends each one.

    HeaderWhat makes it countTypically sent by
    x-litespeed-cacheThe value contains HITLiteSpeed web server with LSCache
    cf-cache-statusThe value contains HITCloudflare
    x-cacheThe value contains HITFastly and many other proxies
    x-cache-status, x-proxy-cacheThe value contains HITNginx proxy or FastCGI cache, if configured to send it
    x-srcache-fetch-status, x-srcache-store-statusHIT, or STORE for the secondOpenResty srcache module
    x-varnishTwo or more request IDs in the valueVarnish
    cache-controlA max-age of one second or moreAlmost any server or plugin
    expiresA date in the futureAlmost any server or plugin
    ageA number above zeroShared caches and CDNs
    last-modified, etag, viaPresent at all, any valueWeb servers and proxies, cached or not
    x-cache-enabled, x-cache-disabledtrue, or anything other than onRarely anything; core itself notes these seem unused
    The AHosting Site Health Page Cache Header Map — the sixteen response headers WordPress 7.1.2 accepts as evidence of a page cache, and the rule each one must pass. The presence-only row and the cache-control row are the two that produce false results, both covered below.

    Why a Working Cache Still Shows Page Cache Is Not Detected

    The frustrating version of page cache is not detected is the one on a site you know is cached. It happens because the test looks for evidence rather than for the cache, and several perfectly good setups no longer leave the evidence it expects. Each of the four below is visible in the response headers, and none of them is fixed by installing a second cache plugin.

    LiteSpeed Cache Stopped Writing the Drop-In File

    For years, a cache plugin announced itself to this test by leaving advanced-cache.php behind. LiteSpeed Cache removed its use of that file in version 7.4, released in August 2025, because the plugin no longer needs it on modern WordPress. We confirmed the change in the plugin changelog and source for version 7.9.1. The consequence for this test is direct: on a LiteSpeed site the drop-in route is gone, and the only remaining proof is the X-LiteSpeed-Cache response header reading hit. The plugin also registers that header, and two related ones, with Site Health through the supported filter. So if none of the three requests is served from cache, a site running LiteSpeed will show page cache is not detected even though the cache is installed.

    A Custom Proxy Header Site Health Has Never Heard Of

    Nginx does not send a cache status header by default. Administrators add one, and they name it whatever they like. The widely copied examples in the NGINX caching guide use X-Cache-Status, which is on the list, but a header named after the FastCGI cache, or after the hosting company, is not. Your cache works, visitors get cached pages, and the test reports page cache is not detected because the one header announcing it has a name WordPress was never told about.

    The Homepage Is the One Page Not Being Cached

    Page cache is not detected on a cached site very often means the homepage is the exception. The test only ever requests the homepage. Sites that exclude the front page from caching, because it shows a live feed, a rotating offer or a geolocated banner, are cached everywhere else and uncached on the single address the test checks. A cache status reading MISS on all three requests is the fingerprint. So is a homepage that sets a cookie on every visit, since many caches refuse to store a response that sets one.

    A Staging Copy Never Runs the Test at All

    Core only registers the page cache test when the environment type is production. On a site marked as staging or development, the test is absent rather than failing, which surprises people comparing a live site with its copy. If you are testing a cache change on a staging site, read the headers directly rather than waiting for a Site Health result that will never appear.

    Why Site Health Can Report a Page Cache That Does Not Exist

    The opposite error gets less attention, and it is the more dangerous one, because a green result stops people looking. The rules that accept evidence are generous enough that a site with no page cache of any kind can pass, and the passing notice lists the headers that satisfied it without saying how weak some of them are.

    Three Headers Count Just by Being Present

    For last-modified, etag and via, core defines no rule at all, which means presence alone is treated as proof. None of the three indicates a page cache. A Last-Modified date can be sent by any theme or plugin that knows when a page last changed. An ETag is a version tag a server may attach to any response. A Via header only says that a proxy relayed the response, not that it stored it. Any one of them, on any one of the three requests, is enough for the test to report a cache.

    A Browser Cache Instruction Is Not a Page Cache

    The rule for cache-control only asks for a max-age of one second or more. It does not check who the instruction is for. A response marked private, which tells shared caches not to store it and allows only the visitor’s own browser to keep a copy, passes the test just as well as one a CDN is actually serving. So does a max-age that a theme adds to every response while the server still builds each page from scratch. The header describes what a cache is allowed to do, not what any cache did.

    What Our Own Blog Returned When We Asked Three Times

    Rather than describe in the abstract how Site Health concludes that a page cache is not detected, we ran its three requests against this blog on 23 September 2026, from outside the server the way a visitor would, and read what came back. The blog sits behind Cloudflare, which makes it a useful example: one layer, several headers, and a first request that behaves differently from the rest.

    A Miss, Then Two Hits

    The first request came back in 596 milliseconds with cf-cache-status: MISS, which means the edge had no stored copy and fetched one. The second and third came back in 169 and 244 milliseconds, both reading cf-cache-status: HIT. All three carried cache-control: public, max-age=300 and a last-modified date. The second and third also carried age: 0, which fails its rule, because zero is not above zero. A single-request check run at the wrong moment would have reported no cache at all.

    What Site Health Would Make of It

    Apply the rules and the result is easy to predict. Sorted from slowest to fastest the timings are 596, 244 and 169, so the median is 244 milliseconds, comfortably under the threshold. Three headers qualify once the responses are merged: the Cloudflare HIT, the max-age of 300, and the last-modified date. The label would be Page cache is detected and the server response time is good. Notice that two of those three would have been present with the edge cache switched off, which is the false-positive problem in miniature. The HIT is the only one that proves anything.

    How to See Exactly What the Page Cache Test Saw

    You do not need Site Health to reproduce its verdict, and reproducing it yourself is faster than rerunning the test from the dashboard, because you see every header rather than a summary. Three methods work, in rising order of how closely they match what the test actually receives.

    Repeat the Three Requests From a Terminal

    From any machine, run curl -sI https://example.com/ three times in a row, replacing the address with your own homepage, and compare the headers. Look for a cache status reading HIT on the second or third attempt. If you see one, a cache is serving that page. Should all three read MISS, something is stopping the homepage from being stored. When no status header appears at all, either no cache sits in front of the site or it reports under a name you will need to look up. REDbot reads the same headers in a browser and explains each one, if a terminal is not to hand.

    Ask From Inside the Server

    The test runs on your server, not on your laptop, and the two can take different routes. If your domain resolves straight back to the origin from inside the server, the loopback never passes through the CDN, and the CDN header you see from home will not reach the test. On a plan with shell access, running the same command on the server shows the test’s own view. Without shell access, the test’s summary lists the headers it detected by name, which is the same information after the fact.

    Read the Header Documentation for Your Layer

    Every cache that sends a status header documents its values, and the values are where the surprises are. Cloudflare’s cache response reference explains why an HTML page often reads DYNAMIC rather than MISS, which means the page was never eligible to be stored in the first place. The Fastly X-Cache reference covers the combined values a two-tier cache sends. The Varnish HTTP notes explain why its header counts only when it carries two numbers.

    How to Fix Page Cache Is Not Detected on LiteSpeed, Nginx and Behind a CDN

    With the headers in front of you, the fix for page cache is not detected is specific to what they said. Enter your three observations in the predictor below to see the label Site Health will print and the first thing to change, then use the table after it to match your stack to the fix.

    Site Health Page Cache Result Predictor

    Request your homepage three times and note what came back. Enter it here and this applies the same decision rules WordPress 7.1 uses, so you can see which label Site Health will print, why, and what to change first.

    —

    Status:

    Why:

    Do this first:

    This mirrors the rules in the WordPress 7.1.2 source and nothing else, so it cannot see your site. A plugin can add headers to the accepted list, which would change the result for the better.

    Fixes by Stack When Page Cache Is Not Detected

    What your headers showedLikely causeFixWhat not to do
    LiteSpeed server, no x-litespeed-cache header at allThe LiteSpeed Cache plugin is not active, so nothing tells the server what to storeActivate the plugin and enable caching, then request the homepage twiceInstall a second cache plugin alongside it
    x-litespeed-cache: miss on every requestHomepage excluded, a cookie set on every visit, or a cache purged by each test runCheck the exclusion lists and look for a plugin that sets a cookie on the front pageAssume the server cache is broken
    Nginx cache working, but its status header has a custom nameThe header is not on the accepted listRename it to X-Cache-Status, or register it through the filterAdd a fake header that does not track the real cache state
    Cloudflare reads DYNAMIC on the homepageHTML is not eligible for edge caching under the current rulesAdd a cache rule for HTML with the admin and login paths excludedCache every path including the admin area
    No caching headers of any kind, from any layerNo page cache existsTurn one on at the server level where the host provides itStack two page caches that each hold their own copy
    Fixes for page cache is not detected, by what the response headers showed. The last column matters as much as the fix: every entry in it makes the message go away while leaving the site no faster, or slower.

    Registering a Header the Test Does Not Know

    When your cache works and simply reports under an unfamiliar name, core offers the site_status_page_cache_supported_cache_headers filter for exactly this case. A short snippet in a site plugin adds the header and a rule for reading it, for example $headers['x-fastcgi-cache'] = function ( $v ) { return false !== stripos( $v, 'hit' ); }; followed by returning the array. Register the header your cache genuinely sends and read its real HIT value. A rule that returns true for any value turns the test into a decoration.

    When the Slow Half of the Message Is the Real Problem

    If the label ends in response time is slow, the status is critical and the cache is only half the story. An uncached homepage that takes 600 milliseconds or more is usually waiting on PHP and the database, and a page cache fixes that by skipping both. A cached homepage that is still slow is waiting on something in front of PHP, and caching harder will not help. We separated those two cases in detail in the guide to reducing time to first byte, and the split there applies directly to this result.

    A Practical Checklist for Page Cache Is Not Detected

    1. Read the full heading, not the first four words. Recommendation or critical is decided by the median response time, and that tells you whether this is urgent.
    2. Request your homepage three times and note every caching header. A HIT on any request means a cache is working and the test is failing to recognize it.
    3. If a request fails or returns anything other than 200, fix the loopback or the redirect before touching the cache.
    4. On LiteSpeed, confirm the LiteSpeed Cache plugin is active, because the drop-in file the test once looked for no longer exists.
    5. On a custom proxy, compare its status header name with the accepted list, and rename it or register it if it is missing.
    6. If the only headers are Last-Modified, ETag or Via, treat a passing result as unproven until a real cache status header appears.
    7. After any change, request the homepage twice more and confirm the second request reads HIT before rerunning Site Health.

    Why a Page Cache Matters More on Shared Hosting

    A fast result reading page cache is not detected is real, and it is also a measurement of one visitor at a time. What an uncached page costs on shared hosting is concurrency. Every uncached visit holds one PHP process for as long as the page takes to build, and our shared hosting plans publish that ceiling rather than hiding it: up to 30 concurrent PHP processes on Bronze and 40 on Silver. A burst of visitors to an uncached homepage fills those quickly, and the symptom is the queueing we traced in the guide to PHP workers and 503 errors. A cached visit holds none of them.

    Where the Work Stops Being Yours

    What we take off your hands is the layer the test is looking for. Every one of our WordPress plans runs on LiteSpeed with LSCache included, and a page served from LSCache consumes no PHP process at all, so the ceiling above is reserved for the requests that genuinely need PHP. The headers, the exclusions and the plugin switch are yours to check, and this guide covers all of them. Where a store is doing the work, the WooCommerce plans start from a larger allocation, because carts and checkouts can never be served from cache. And where a site has outgrown shared limits even with caching on, a VPS is the honest next step.

    Frequently Asked Questions About Page Cache Is Not Detected

    How do I fix page cache is not detected in WordPress Site Health?

    Typically by finding out which of two things is missing rather than by installing another plugin. Site Health accepts a cache as present when the homepage returns one of a fixed list of caching headers, or when a cache drop-in file exists and caching is switched on in the configuration. Request your homepage three times from a terminal and read the headers. If a header saying HIT appears, your cache works and the test simply does not recognize it. If nothing appears at all, no cache is serving that page and turning one on is the actual fix.

    Why does Site Health say page cache is not detected on a cached site in 2026?

    Specifically because the test looks for evidence of a cache, not for the cache itself, and several popular setups no longer leave the evidence it expects. The most common one this year is LiteSpeed Cache, which stopped writing a drop-in file in version 7.4, so on those sites the only proof left is a response header. Custom proxy headers the test has never heard of, a homepage excluded from caching, and a homepage that redirects or returns an error all produce the same message on a site that is otherwise cached perfectly well.

    Is page cache is not detected but the server response time is OK safe to ignore?

    In practice it is usually safe to leave for a day, and it is not safe to leave forever. That exact wording is a recommendation, not a critical result, and it means the median of three homepage requests came back under 600 milliseconds. So visitors are not waiting today. The risk is what happens under load: an uncached page runs PHP on every visit, and the fast result was measured with one request at a time. A site that answers quickly alone can still queue badly when fifty people arrive together.

    Does AHosting LiteSpeed hosting ever show page cache is not detected?

    That said, it can, and it is worth being plain about when. AHosting WordPress plans run LiteSpeed with LSCache available, and a cached homepage there is marked with a response header the test recognizes. The message appears when the LiteSpeed Cache plugin is not active on the site, when the homepage has been excluded from caching, or when something on the front page sets a cookie that stops it being stored. None of those is a server fault, and each one is visible in the response headers within a minute of looking.

    Page cache vs object cache: which one does this Site Health check actually measure?

    By contrast with how often the two are confused, this test measures only the page cache. A page cache stores the finished HTML so the server can skip WordPress entirely. An object cache stores the results of database queries so WordPress runs faster when it does run. Site Health checks the second one in a separate test with a separate message about a persistent object cache. Fixing one never clears the other, so read the heading of the notice before deciding which layer to work on.

    LiteSpeed Cache vs a Cloudflare edge cache: which one does Site Health see?

    Notably it sees whichever one answers the request its own server sends to the homepage, and that is not always the one visitors hit. The test fetches the public homepage address from inside the server. If that address resolves through the proxy, a Cloudflare HIT header can satisfy it; if it resolves straight back to the origin, only the origin cache can. Both headers are on the list. Read what the test itself was served rather than what your browser was served, because the two paths can differ.

    Will an AHosting plan upgrade fix a slow page cache is not detected result in 2026?

    Ultimately only if the slow half of the result is caused by the plan, and usually it is not. The critical version of this message means the median homepage response took 600 milliseconds or longer. A missing cache is the usual reason, and turning a cache on costs nothing. If the page is slow even when served from cache, the cause is in front of PHP rather than inside it. More processes and memory help an uncached site that is queuing under traffic, which is a real case but a different diagnosis.

    Can I add my own cache header so the page cache check passes?

    Indeed you can, and core provides a filter for exactly that purpose. The list of headers the test accepts is passed through site_status_page_cache_supported_cache_headers, so a site behind a proxy that reports its cache status under an unusual header name can register that header and a rule for reading it. Register the header your cache genuinely sends. Adding a header purely to satisfy the test hides the one signal the test exists to give you, which is whether visitors are being served from cache.

    Does AHosting count cached pages against my entry process limit?

    Fortunately not, and it is the practical reason a page cache matters more on shared hosting than the test result suggests. A page served from LSCache on an AHosting plan never starts PHP, so it consumes none of the concurrent PHP processes the plan allows. An uncached page consumes one for as long as it takes to build. That is why the same site can feel fine alone and stall under a burst of visitors: the limit that matters is concurrency, and caching is what keeps ordinary visits out of it.

    Does page cache is not detected affect SEO or Core Web Vitals in 2026?

    Interestingly the message itself affects nothing, because search engines never see Site Health. What they do see is the first byte of every page they crawl, and an uncached page is slower to produce that byte than a cached one. On a quiet site the difference can be small. On a busy one it compounds, because uncached pages queue behind each other for processes. So the notice is not a ranking problem, but the condition it describes can become one when traffic arrives.

    September 23, 2026
  • Updating Failed: The Response Is Not a Valid JSON Response — Read the Response, Not the Checklist

    Updating Failed: The Response Is Not a Valid JSON Response — Read the Response, Not the Checklist

    • What the Not a Valid JSON Response Error Actually Means
      • The Editor Asked for Data and Got a Web Page
      • Why a Valid JSON Response Matters More Than the Save Itself
    • Why the Valid JSON Response Error Tells You Nothing
      • The Catch Block That Throws the Evidence Away
      • The Editor Also Refuses to Print Anything That Looks Like Markup
      • Two Rules, One Result: The Notice Cannot Contain the Cause
    • The Sixty-Second Diagnosis: Read the Response Yourself
      • Open the Network Panel Before You Touch a Plugin
      • Three Things to Write Down
      • Why Reading the Body Beats Deactivating Plugins
    • What the Response Turns Out to Be
      • What a Valid JSON Response Signature Looks Like in Each Case
    • Proof That a Real WordPress Failure Is Still a Valid JSON Response
      • What a Rejection From WordPress Looks Like
      • What a Page From the Web Server Looks Like
      • The Rule This Gives You
    • The Five Things That Answer Instead of WordPress
      • A Firewall Rule Matching Your Own Post Text
      • Rewrite Rules That No Longer Route the Request
      • PHP Printing Output in Front of the Data
      • A Proxy or CDN Answering in the Server Place
      • The Request Stopped Part Way Through
    • Fixing Each Cause of a Not a Valid JSON Response Error
      • What Each Fix Costs and What It Leaves Untouched
      • What Not to Do About a Not a Valid JSON Response Error
    • A Practical Checklist for a Not a Valid JSON Response Error
      • When a Valid JSON Response Failure Is Really About Headroom
      • Where the Work Stops Being Yours
      • One Last Note on Reading Responses
    • Frequently Asked Questions About the Not a Valid JSON Response Error
      • How can I fix the "invalid JSON response" error in WordPress?
      • Why is the response not a valid JSON response on a site that worked in 2026?
      • What does a valid JSON response from WordPress actually look like?
      • Does AHosting block the REST API and cause a not a valid JSON response error?
      • Permalinks vs .htaccess: which one actually causes an invalid JSON error?
      • Firewall vs plugin conflict: how do I tell which is breaking a valid JSON response?
      • Can caching cause a not a valid JSON response on AHosting in 2026?
      • Why does the block editor not show me the real error message instead?
      • Does a bigger AHosting plan fix an invalid JSON response error?
      • Is a not a valid JSON response error a security problem in 2026?
    TL;DR

    The block editor saves your post by asking the server for structured data, and this message means the reply was not structured data — it was a web page, or it had something printed in front of it. The editor cannot tell you which, because the code that catches the failure throws the reply away before composing the message. So do not work through a list of ten fixes: open the browser network panel, save again, and read the failed request. Its status code, content type and first characters name the cause in about a minute.

    What the Not a Valid JSON Response Error Actually Means

    When the block editor prints Updating failed. The response is not a valid JSON response., it is reporting one narrow technical fact and nothing more: it asked the server for structured data, and what came back could not be read as structured data. That is the entire meaning. It is not a statement that a plugin is broken, that the database is corrupt, or that the post is lost — and the post is almost never lost, which is the first thing worth knowing. The reply was a web page, or it was data with something printed in front of it. Which of those, and who sent it, is a question the message deliberately cannot answer.

    Listen: the editor discards the server reply before it composes the message, so the notice you are reading cannot contain the cause, and the browser still has the evidence. By Matt Chrust, Director of Business Development, AHosting.

    The Editor Asked for Data and Got a Web Page

    Saving a post in the block editor is not a form submission. The editor sends the post to a dedicated programming interface built into WordPress — the REST API that core has shipped since version 4.7 — and expects an answer in a strict machine format. That format is defined by ECMA-404, the international standard for JSON, and it is unforgiving by design: a document either parses or it does not, with no tolerance for stray characters. A page of markup beginning with an angle bracket fails at the very first character. So does correct data with a single line of warning text in front of it.

    Why a Valid JSON Response Matters More Than the Save Itself

    Here is the counter-intuitive part, and it reframes the whole problem. In a large share of cases the save already worked. The post was written to the database, the server composed its reply, and then something added to that reply or replaced it. The editor could not read the answer, so it assumed failure and told you so. Reloading the page in those cases shows the change present and saved. That single observation should change what you do first: before touching a plugin, reload and look, because it separates a real failure from a failure to communicate.

    Why the Valid JSON Response Error Tells You Nothing

    Every guide on this error is a list of ten things to try, and there is a reason for that shape which nobody writing them explains. The error is uninformative by construction. Two specific decisions in the WordPress source code remove the evidence before the message reaches you, and once you know what they are, the ten-item checklist stops looking like thoroughness and starts looking like what it is: guesswork forced by a missing diagnosis.

    The Catch Block That Throws the Evidence Away

    The code that reads the reply ships with WordPress and runs in your browser on every save. Its job is to parse the response, and its failure path is three lines long. The function is named parseJsonAndNormalizeError, and when parsing fails it catches the failure without capturing it — the catch takes no argument at all. It then throws a fixed object carrying the code invalid_json and the one sentence you are reading on screen. The status code is gone. So are the headers. Nothing is left of the body. Whatever the server actually said is discarded at that line, and no later code can recover it, because nothing kept it.

    The Editor Also Refuses to Print Anything That Looks Like Markup

    The second decision sits in the editor itself, where the notice is composed. Before appending an error message to the words Updating failed., the editor tests that message against a pattern that matches anything resembling a markup tag, and drops the message if it matches. The intent is sound: it prevents a raw error page being rendered into the interface. The consequence is that in exactly the situation where the server sent you a page explaining the problem — a firewall block naming its own rule, for instance — that explanation is the one thing guaranteed not to reach the screen.

    Two Rules, One Result: The Notice Cannot Contain the Cause

    Put the two together and the outcome is structural. The first rule destroys the evidence; the second would suppress it even if it survived. No amount of reading the notice more carefully will help, because the notice is not a summary of what happened. It is a placeholder printed where the explanation would have gone. That is why the fix is not a longer checklist but a different move entirely: go and read the response yourself, in the one place it still exists.

    Where a web page gets returned instead of a valid JSON response A block editor save travels through four layers before it reaches the part of WordPress that answers with structured data, and each layer can answer in its place. The content delivery network or proxy can return a challenge page or a stored error page. The web application firewall can match the submitted content and return a block page carrying a 403 status. The rewrite rules can fail to route the request, so the server answers with an ordinary not-found page carrying a 404 status. PHP itself can print a warning or a stray line of output before the data, which corrupts an otherwise correct reply. Only the last layer produces structured data, and every earlier one produces markup that cannot be parsed. Four layers can answer before WordPress does. Each one replies with a web page. Only the last one replies with data the editor can read. 1. CDN or proxy Challenge page or a stored error page Status 403 or 5xx 2. Firewall rule Matches your post text, returns a block Status 403 3. Rewrite rules Route missing, so an ordinary page answers Status 404 4. PHP output A warning printed in front of the data Status 200 5. WordPress answers correctly Even a rejection is well formed data, carrying a code, a message and a status, so the editor shows that message instead. What the editor does with all five It tries to read the reply as data. If that fails it discards the reply entirely and prints one fixed sentence. The status code and the first character of the body identify which layer answered. That is one look in the network panel, and it replaces the whole checklist.

    The Sixty-Second Diagnosis: Read the Response Yourself

    The response never reached the editor intact, but it did reach your browser, and the browser keeps it. Every modern browser ships a network panel that records each request a page makes, along with the exact bytes that came back. Opening it turns a not a valid JSON response error from a guessing game into a lookup, and the whole procedure takes under a minute. It needs no server access, no plugin, and no help from anyone — which matters, because most people hitting this error are locked out of their own work while they read about it.

    Open the Network Panel Before You Touch a Plugin

    Press F12, or right-click the page and choose Inspect, then select the Network tab. In Safari the equivalent is the Web Inspector Network tab, which records the same information. Leave the panel open and save the post again so the failed request is captured. You are looking for the request made at the moment you clicked save: it will be a POST, and its address will contain either the letters wp-json or the words rest_route. Click it. Everything you need is in the Headers and Response sub-tabs.

    Three Things to Write Down

    Record the status code, the content type, and the first forty characters of the body. Those three facts are sufficient to name the cause in every case this guide covers, and they take ten seconds to read. The status code is in the Headers tab. Content type sits in the same tab, on the response side. The body is in the Response tab, and the very first character is the one that matters most — an angle bracket means a web page answered, and a brace means the data was correct but something else was wrong.

    Why Reading the Body Beats Deactivating Plugins

    The conventional advice is to deactivate every plugin, confirm the error clears, then reactivate one at a time. That procedure works, eventually, and it takes an hour on a site with thirty plugins. It also fails outright when the cause is not a plugin, which is most of the time. Worse, on a live site it means turning off the security plugin and the cache while visitors are watching. The response body identifies the layer at fault directly, so you deactivate plugins only in the one case where plugins are actually implicated.

    What the Response Turns Out to Be

    Across the five things that can answer in WordPress place, each leaves a distinct and easily recognized signature. The table below is the whole diagnosis, and it is worth keeping open in a second tab while you read the request you just captured. Match your three recorded facts against a row and the cause is named; the remedy in the last column is then the only work you need to do.

    What a Valid JSON Response Signature Looks Like in Each Case

    Status codeHow the body startsWhat answered instead of WordPressWhat to change
    403An angle bracket, then a page mentioning a block or a reference numberA web application firewall, either a plugin inside the site or a service in front of itFind the reference in the firewall log and correct the one rule that matched
    404An angle bracket, then your own theme not-found pageThe web server, because the route to the interface did not resolveRe-save the permalink settings to rewrite the rules file on disk
    200Readable text or a warning, and then your post data further downWordPress answered correctly, and PHP printed output in front of the answerFix the warning at its source and stop errors being displayed on a live site
    500 or 503An angle bracket, then a short server error pageThe request reached the application and stopped part way throughRead the error log entry, and treat a resource ceiling as a headroom problem
    200 or 5xxNothing, the body is emptyThe process was terminated before it could write a replyLook for a memory or execution limit in the log at the same timestamp
    The AHosting Invalid JSON Response Decoder Table — the five signatures a failed save leaves, read from the status code and the first characters of the response body. The 200 row is the one people misdiagnose most often, because the save succeeded and the reply was spoiled after the fact.

    Proof That a Real WordPress Failure Is Still a Valid JSON Response

    One assumption underlies the entire table above, and it deserves to be demonstrated rather than asserted, because it is the fact that makes the diagnosis reliable. The assumption is this: when WordPress itself rejects a request, it answers in the correct format anyway. A refusal is not malformed. So this error can never be caused by WordPress declining to do something — it can only be caused by something else answering, or by the answer being spoiled in transit.

    What a Rejection From WordPress Looks Like

    We sent a deliberately invalid save request to this blog — a POST to a post that does not exist — on 16 September 2026. The server returned status 404, which is a hard failure. It also returned the content type for structured data, and this body: {"code":"rest_post_invalid_id","message":"Invalid post ID.","data":{"status":404}}. That parses perfectly. Handed to the editor, it would have produced a clear notice reading Invalid post ID and no mention of JSON at all. A failure from WordPress tells you what failed.

    What a Page From the Web Server Looks Like

    We then requested an address on the same site that does not resolve to anything. The server returned status 404 again — the same status — but this time the content type was markup and the body was 137,871 bytes of it, beginning with an angle bracket and a document type declaration. Parsing that as structured data fails at character one. Two responses, identical status codes, completely different outcomes in the editor. The status code alone is therefore not enough, which is exactly why the first character of the body is the second thing worth recording.

    The Rule This Gives You

    From those two probes comes a test you can apply without any further knowledge. If the response parses, WordPress is talking to you and you should read what it says. If it does not parse, WordPress is not the thing talking, and looking for the fault inside WordPress is looking in the wrong place. Almost every wasted hour on a not a valid JSON response error comes from reversing that rule and hunting through plugins while a firewall or a rewrite file is answering the request.

    The Five Things That Answer Instead of WordPress

    Ordered by how often they occur in practice rather than by how often they are blamed, the five causes of a not a valid JSON response error divide cleanly. Four of them are configuration and cost nothing but attention. The fifth is a genuine resource problem, and it is both the rarest and the only one where the answer involves the plan the site runs on.

    A Firewall Rule Matching Your Own Post Text

    This is the most common cause and the most misleading, because it can follow one specific article while every other post saves normally. Rule sets used by ModSecurity, the open-source web application firewall and by the security plugins that wrap it inspect what is being submitted, and post content is submitted here. An article about SQL, a code sample, a shell command or an unusual string of punctuation can match a generic injection rule. The firewall then returns its own page with a 403 and a reference number. Nothing is compromised and nothing is broken; a rule matched text it was not written for.

    Rewrite Rules That No Longer Route the Request

    The address the editor calls is a pretty permalink, and it works only while the rewrite rules on disk are intact. Migrations, security plugins that harden file permissions, and failed updates all overwrite that file. When the rule is gone the request falls through to the ordinary page handler, which cannot find a page at that address and returns a 404 wrapped in your theme. Re-saving the permalink settings regenerates the file, which is why that advice appears everywhere without explanation.

    PHP Printing Output in Front of the Data

    A deprecation notice, a warning from an outdated plugin, or a stray blank line after a closing tag in a theme file all write text to the output before WordPress sends its reply. The data is still there, intact, further down the body. The parser never gets that far. This is the case where the save genuinely succeeded, and it is closely related to the output problems behind the WordPress white screen of death, where the same stray output arrives with nothing after it at all.

    A Proxy or CDN Answering in the Server Place

    Where a content delivery network or security proxy sits in front of the domain, it can answer a request without the server ever seeing it. A bot-protection challenge, a rate limit or a cached error page all come back as markup. Requests to the editor interface should never be cached, and a properly configured setup excludes them, but a broadly written rule catches them easily. We covered how those layers interact on this platform in the guide to running LiteSpeed Cache behind Cloudflare, and the exclusion list there applies directly.

    The Request Stopped Part Way Through

    The last cause is the only genuine resource failure. A save that hits a memory ceiling or is terminated for exceeding a process limit produces a 500 or 503 and a server error page, or sometimes an empty body. The distinguishing feature is timing: it arrives under load rather than constantly, and it tends to affect long posts and large block structures first. A related limit produces a different message entirely, which we covered in the guide to the expired link error — worth reading if your saves fail on size rather than on content.

    Fixing Each Cause of a Not a Valid JSON Response Error

    With the layer identified, each fix for a not a valid JSON response error is short and specific. Work the one your response points at and leave the others alone, because changing several things at once removes your ability to tell which one mattered. The decoder below takes the three facts you recorded and names the layer, and the table after it sets out what each fix costs and what it will not solve.

    Invalid JSON Response Decoder

    Save the post again with the browser network panel open, click the request that failed, and read three things off it. Enter them here and this names the layer that answered, what to change, and whether the problem is inside your site or in front of it.

    —

    What answered instead of WordPress:

    Do this first:

    What this is not:

    This reads the three facts you recorded and nothing else, so it cannot see your site. Treat it as a way to order the work rather than a verdict, and confirm each change against the response before moving to the next one.

    What Each Fix Costs and What It Leaves Untouched

    The layer that answeredThe fixWhat it costs youWhat it does not fix
    A firewall ruleCorrect the single rule using the reference number in the block pageA few minutes in the firewall log, and nothing on the live siteAnything else in the chain. Switching protection off entirely is not a fix
    Rewrite rulesRe-save the permalink settings, which rewrites the rules fileNothing. Your settings are unchanged by re-saving themA file the server cannot write to, which will silently fail to regenerate
    PHP output before the dataFix the warning at its source, and stop displaying errors publiclyReading the log entry the output already named for youThe underlying deprecation, if you only hide the display of it
    A proxy or CDNExclude the editor interface addresses from caching and challengesOne rule change, applied in front of the site rather than inside itA firewall rule inside the site, which lives at a different layer
    A resource ceilingRead the log, then add headroom where the ceiling is genuinely reachedEither a configuration change or a plan that fits the workloadConfiguration causes. Headroom will not fix a rule that matched your text
    What each fix costs and what it leaves untouched — the five remedies mapped against the layer each one addresses. The right-hand column is the one to read twice: no single change here helps if the layer you corrected is not the layer that answered.

    What Not to Do About a Not a Valid JSON Response Error

    • Do not disable the security plugin or the firewall outright. One rule matched your text; removing every rule to avoid correcting one is a large trade for a small problem.
    • Do not switch to the classic editor as a permanent fix. It sends the save as an ordinary form submission, which sidesteps the symptom and leaves the broken layer in place for everything else that uses the interface.
    • Do not deactivate plugins first. It is an hour of work that answers the question only in the one case where the status code was 200, and the status code is free to read.
    • Do not assume the post was lost. Reload before you retype anything, because a spoiled reply to a successful save is one of the commonest shapes this takes.
    • Do not paste the post body somewhere else to see if it saves. If a firewall rule is matching the content, you will reproduce the problem faithfully and learn nothing new.
    • Do not buy a larger plan on the strength of this error alone. Four of the five causes are configuration, and a bigger plan changes none of them.

    A Practical Checklist for a Not a Valid JSON Response Error

    1. Reload the post before anything else. If your change is there, the save worked and you are chasing a spoiled reply rather than a failed write.
    2. Open the browser network panel, save again, and find the POST request carrying wp-json or rest_route in its address.
    3. Record three things from it: the status code, the content type, and the first forty characters of the response body.
    4. Match those against the decoder table. The first character of the body separates a web page from spoiled data, and the status code separates the layers.
    5. Change only the thing the response points at, then save again with the panel still open and confirm the response is now well formed.
    6. If the status was 200 and text preceded your data, turn off public error display on the live site once the warning itself is fixed, not instead of fixing it.
    7. If the status was 500 or 503 and it arrives under load, read the error log at that timestamp before concluding anything about the plan.

    When a Valid JSON Response Failure Is Really About Headroom

    Four of the five causes are yours to correct in an afternoon and need nothing from a host. The fifth is the one worth being honest about, and it is genuinely the rarest: a save that is terminated part way because the account has reached its concurrent process or memory ceiling. On our WordPress plans those ceilings are published rather than discovered, and they were last verified on 9 September 2026 — 30 concurrent PHP processes and 2 GB of memory on Bronze, 40 and 3 GB on Silver, 50 and 4 GB on Gold. A long post with a large block structure saving while a backup runs is the realistic way to meet one of them.

    Where the Work Stops Being Yours

    What we take off your hands is the layer underneath the fix rather than the fix itself. LiteSpeed and its cache keep ordinary page requests out of PHP entirely, so the processes your plan allows stay available for the work that needs them, and the server-side cache excludes the editor interface by default so it is never the thing answering your saves. On the shared hosting plans the error log is in the control panel where you can read it yourself in the same sitting. Where a store is doing the saving, the WooCommerce plans start at the larger allocation for that reason. And where an account genuinely no longer fits, a VPS is the honest answer rather than a larger shared plan. The rule that matched your text is still yours to correct; the headroom around it is ours.

    One Last Note on Reading Responses

    The habit this error teaches is worth more than the fix. A browser network panel shows you what a server actually said, and the parsing method the editor relies on behaves the same way everywhere, because the Fetch Standard defines it for every browser. Any tool that reports a communication failure without quoting the response is asking you to guess, and the response is almost always still available somewhere. Reading it first is the fastest move in nearly every case, not only this one.

    Frequently Asked Questions About the Not a Valid JSON Response Error

    How can I fix the “invalid JSON response” error in WordPress?

    Typically the fix is chosen after the diagnosis rather than before it, and that ordering is the whole difference between five minutes and an afternoon. Open the browser network panel, save the post again, and read the failed request: its status code, its content type, and the first characters of its body. Those three facts name the cause on their own. An HTML body with a 403 status is a firewall, an HTML body with a 404 is a rewrite problem, and a body that starts with readable text before the data is a plugin printing output. Fix the one the response points at.

    Why is the response not a valid JSON response on a site that worked in 2026?

    Specifically because something in front of the application changed while the application did not. The editor sends the same request it always sent, so a site that stops accepting it has usually gained a new layer rather than lost a feature. The common triggers are a security plugin updating its rule set, a firewall or proxy being switched on, a certificate or domain change that leaves the saved site address pointing somewhere else, and a rewrite flush that drops the rule routing requests to the interface the editor uses. None of those touch the post you were editing.

    What does a valid JSON response from WordPress actually look like?

    In practice it starts with a brace or a bracket and nothing else, because that is what the data format allows. A successful save returns the whole post as structured data. A failed save returns an error object carrying a code, a message and a status, which is still perfectly well formed. That second case is the one worth remembering: a rejection from the application is not malformed, so it produces a clear message in the editor rather than this one. Anything beginning with an angle bracket is a web page, and a web page is never a valid response here.

    Does AHosting block the REST API and cause a not a valid JSON response error?

    Fortunately no, and it is worth saying plainly because a host is the first thing suspected. AHosting shared and WordPress plans leave the interface the block editor depends on reachable by default, and a default install saves normally on them. What can block it is a rule inside a security plugin you installed, a firewall service placed in front of the domain, or a hand-edited rewrite file. Those are all inside the account rather than under it, which is why the diagnosis in this guide points at the response itself instead of at the plan.

    Permalinks vs .htaccess: which one actually causes an invalid JSON error?

    Notably they are two names for one mechanism, which is why the advice to re-save permalinks works without anybody explaining it. The saved permalink setting lives in the database; the rules that make it work live in the rewrite file on disk. Re-saving the setting rewrites that file. When the file has been overwritten by a migration, a security plugin or a failed update, the route the editor calls stops resolving and the server answers with an ordinary page instead. Re-saving does not change your settings, so it is safe to try early.

    Firewall vs plugin conflict: how do I tell which is breaking a valid JSON response?

    By contrast with each other these two leave completely different fingerprints, and the response body shows which you have. A firewall returns its own page, so you see a 403 status and a body mentioning a block, a reference number or a support identifier that does not belong to your site. A plugin printing output returns a 200 status with your data present but preceded by a warning or a stray line of text. If the body is your post data with something in front of it, no firewall is involved and deactivating plugins is the right move.

    Can caching cause a not a valid JSON response on AHosting in 2026?

    Indeed it can, although less often than it is blamed, and the mechanism is specific. Saves are sent to an address that should never be cached, so a correctly configured cache passes them straight through. Trouble starts when a rule is written broadly enough to catch them, or when a proxy in front of the site serves a stored error page to a request that should have reached the server. On AHosting the server-side cache excludes those addresses by default, so a cache implicated here is usually one added inside the site or in front of the domain.

    Why does the block editor not show me the real error message instead?

    Consequently this is the most reasonable question on the page, and the answer is in the code rather than in anyone opinion. The routine that reads the reply catches the failure without capturing what failed, so the status, the headers and the body are gone before any message is composed. The editor then declines to display any message containing something that looks like markup. Between those two rules, the notice you are shown cannot contain the evidence, no matter what went wrong. The evidence still exists in the browser, which is why reading it there works.

    Does a bigger AHosting plan fix an invalid JSON response error?

    Ultimately only in one of the five cases, so upgrading on the strength of this error alone is usually the wrong purchase. Four of the causes are configuration and cost nothing to correct. The fifth is genuine: when a save is stopped part way because the account has hit its concurrent process or memory ceiling, the server returns an error page and the editor reports this message. That case shows a 500 or 503 status in the response, arrives under load rather than constantly, and is the only one where more headroom is the actual answer.

    Is a not a valid JSON response error a security problem in 2026?

    Interestingly it is more often the opposite: the sign of a security control doing exactly what it was configured to do, to a request that happened to be yours. A firewall rule that inspects submitted content will sometimes match ordinary post text, which is why the error can follow one specific article and no others. That is a tuning problem rather than a breach. The genuine security mistake would be the reflex fix people reach for next, which is disabling the protection entirely instead of correcting the single rule that matched.

    September 17, 2026
  • The Link You Followed Has Expired: What WordPress Really Means, and How to Fix It on Shared Hosting

    The Link You Followed Has Expired: What WordPress Really Means, and How to Fix It on Shared Hosting

    • What “The Link You Followed Has Expired” Actually Means
      • Where the Sentence Comes From in WordPress Core
      • Why It Says Expired When the Link You Followed Has Expired Is Not Literally True
    • Why an Upload Makes the Link You Followed Has Expired Appear
      • Why the File and the Token Travel in the Same Envelope
      • What the Token Is Actually Defending
    • The Four Limits That Decide Whether Your Upload Survives
      • Why upload_max_filesize Is Rarely the Limit That Breaks First
    • Reading Your Own Limits Before You Change Anything
      • The Number the Media Library Shows, and What It Leaves Out
      • Matching the Symptom to the Limit
    • How to Fix the Link You Followed Has Expired on cPanel Shared Hosting
      • Why functions.php and .htaccess Advice Usually Fails
    • When the File Size Is Not Why the Link You Followed Has Expired
      • A Genuine Expiry: the Twelve-to-Twenty-Four-Hour Window
      • A Cached Page Serving Somebody Else’s Token
      • Too Many Fields: max_input_vars on Menus and Page Builders
    • What the Ceilings Look Like on AHosting Shared Plans
      • Reading the Memory Column Before You Raise memory_limit
      • When a Shared Plan Is Genuinely the Wrong Place for This
    • A Practical Checklist Before You Touch Any PHP Setting
      • The Nine Checks, in the Order That Costs You Least
      • Change One Value at a Time, and Re-Test Between Each
    • Frequently Asked Questions About the Link You Followed Has Expired
      • Why does my WordPress theme upload say the link you followed has expired?
      • Is the link you followed has expired a real error in 2026 or a browser glitch?
      • post_max_size vs upload_max_filesize: which one causes this message?
      • How do I fix the link you followed has expired on AHosting shared hosting?
      • Why does the link you followed has expired mention expiry at all?
      • Editing functions.php vs the PHP INI editor: why does one of them fail?
      • Does the link you followed has expired mean AHosting limits are too low in 2026?
      • Can a cache plugin cause this WordPress security token failure by itself?
      • How do I tell which limit broke when the link you followed has expired appears on AHosting?
      • Will raising every PHP limit stop the link you followed has expired for good in 2026?
    TL;DR

    Nothing expired. WordPress prints this sentence when a form arrives without a security token it can verify, and on a theme or plugin upload the usual reason the token is missing is that PHP discarded the entire request body for exceeding post_max_size — the file and the token travel together, so both went. Raise the post ceiling above the upload ceiling in cPanel and the message stops. If the file was small, the cause is one of three others, and none of them is a timeout.

    Nothing expired, and that is the first useful thing to know. When WordPress tells you that the link you followed has expired, it has refused a form submission it could not authenticate, and the wording it chose for that refusal is a guess. Core has exactly one sentence for a security token that failed, and it prints that sentence whether the token was old, wrong, or never arrived in the first place. On a theme or plugin upload the token almost always never arrived, and the link you followed has expired is what core says instead, because PHP threw the whole request away before WordPress read a byte of it. That distinction is the difference between a fix that takes a minute and an afternoon spent clearing caches. This guide covers where the sentence comes from, which PHP ceiling actually causes it, how to tell from the wording alone which limit you hit, and the three other causes that have nothing to do with file size.

    Listen: nothing expired, and the sentence WordPress prints is the one it has for any token it cannot verify, including one that never arrived. By Matt Chrust, Director of Business Development, AHosting.

    What “The Link You Followed Has Expired” Actually Means

    It means WordPress received a form it could not verify. Every administrative action in WordPress carries a short-lived token, and the request that arrives without a valid one is refused before anything is written to the database. The refusal is deliberate and it is protecting you from something real. What it is not doing is describing the cause: the message names a symptom that applies to one of several situations and gives you no way to tell which. Reading the link you followed has expired as a statement of fact — that a link aged out — sends most people to their browser, and the browser has nothing to do with it.

    Where the Sentence Comes From in WordPress Core

    One function prints it, and reading that function settles several arguments at once. Core keeps a small helper for exactly this case, and the string it prints is a literal inside it. You can read the whole thing as the wp_nonce_ays function in the WordPress reference, where the relevant branch is four lines long: take the message, append a link back to the page you came from labeled “Please try again”, and stop the request. That second line is why the screen looks like a browser history problem rather than a server one. Notice what the function is never given: the name of the form, the size of the request, or any indication of why verification failed. It cannot tell you, because by the time it runs the information is gone.

    Why It Says Expired When the Link You Followed Has Expired Is Not Literally True

    Two very different failures end at the same function, and core picks the friendlier explanation for both. A token that genuinely aged out is one of them. The other is a token that was never in the request at all, which is what happens on a failed upload, and for that case the word expired is simply wrong. Because the two are indistinguishable at the point the message is written, the wording was chosen to be true often enough rather than true always. The cost of that choice lands on the upload case, where the sentence quietly points every reader at the one place the problem is not.

    Why an Upload Makes the Link You Followed Has Expired Appear

    Because PHP discarded the form before WordPress could read it. The manual is unusually blunt about this: the post_max_size directive states that if the size of post data is greater than the limit, the POST and FILES superglobals are empty. Not trimmed. Not truncated to the part that fits. Emptied. PHP hands WordPress a request with no fields in it at all, and WordPress, finding no security token where one should be, does the only thing it can do with an unverifiable request. The ceiling that triggers this ships at eight megabytes, which a single page-builder theme has exceeded comfortably for about a decade.

    Why the File and the Token Travel in the Same Envelope

    A form with a file in it is still one request, and that is the detail everything else follows from. When the browser submits an upload it runs the multipart/form-data encoding algorithm, which walks every control on the form, collects each one into a single entry list, and encodes that list as one request body. Your forty megabyte theme archive and the forty-three byte security token are neighbors inside that body. So when the body is measured against a ceiling and found too large, there is no mechanism by which the small important part survives and the large part is dropped. Both go, together, and the page you land on reports only that the link you followed has expired.

    Why the link you followed has expired appears on an upload Step one: the browser encodes every form control into a single multipart request body, so the forty megabyte theme archive and the forty-three byte security token are in the same envelope. Step two: PHP compares the size of that body against post_max_size and finds it larger. Step three: rather than trimming the file out, PHP empties both the POST array and the FILES array completely. Step four: WordPress looks in the POST array for the security token, finds an empty array, and the verification call fails. Step five: core calls the function that prints the link you followed has expired, which is the same sentence it prints for a token that genuinely aged out. The message describes the missing token and never the discarded upload. The file and the security token travel in the same envelope. PHP does not trim the envelope when it is too big. It empties it. 1. One request body The browser packs the zip, the token and every field into a single POST 2. The body is measured PHP weighs the whole body against post_max_size, which ships at 8M 3. Both arrays emptied Not trimmed, not truncated. POST and FILES are both handed over empty 4. The token is not there WordPress reads the POST array for the token it issued, finds nothing, and the verification call returns false. 5. One sentence for both cases Core prints the same message for a stale token and an absent one, so it reports an expiry that never happened. Raising the upload ceiling changes nothing at step 2, because step 2 measures the envelope. The ceiling that decides this is the one covering the whole body, and it is a separate setting.

    What the Token Is Actually Defending

    Worth saying plainly, because the instinct when a security check misfires is to turn it off. The token exists to stop a request that you did not intend from being executed with your credentials — a pattern classified as cross-site request forgery, where a page you visit quietly submits a form to a site you are logged into. Without the token, a link in an email could delete a post or install a plugin on your behalf, because your browser would attach your session to it automatically. Every workaround that suggests removing the check is therefore trading a five-minute configuration change for a permanent hole. Fix the ceiling instead.

    The Four Limits That Decide Whether Your Upload Survives

    Four PHP directives sit between a file on your desktop and a theme in your site, and any of the first three can end in the link you followed has expired, and they fail in visibly different ways. Knowing which failure looks like which is most of the diagnosis, because you get exactly one symptom and no log entry the average dashboard user can reach. The table below pairs each ceiling with what it measures and what you see on screen when that ceiling is the one you hit. Only one of the four produces the message this page is about.

    DirectiveWhat it measuresShips asWhat you see when it binds
    post_max_sizeThe entire request body: the file plus every other field on the form8MThe link you followed has expired. The POST array is emptied, so the security token goes with it
    upload_max_filesizeThe uploaded file alone, measured on its own2MA polite notice inside the WordPress screen saying the file exceeds a directive in php.ini, with the page still rendering
    max_input_varsHow many fields arrive, not how large they are1000The same expiry message, or fields silently missing after a save, once later variables are truncated away
    max_execution_timeHow many seconds the PHP process may run30A blank screen or a gateway error part way through unpacking, never this message
    The four PHP ceilings involved in a WordPress upload, their stock values, and the distinct symptom each one produces. Directive defaults are those published in the PHP manual, checked 2026-09-15.

    Why upload_max_filesize Is Rarely the Limit That Breaks First

    Stock PHP pairs a two megabyte upload ceiling with an eight megabyte post ceiling, so out of the box the upload ceiling is the one that binds — and it fails politely. The trouble starts when somebody raises it. A panel default, a host template or a well-meant tutorial pushes the upload ceiling to sixty-four megabytes and leaves the post ceiling at eight, and now the two disagree: WordPress advertises a sixty-four megabyte allowance in its uploader, accepts the file from you, and PHP discards the request on arrival. Every report of the link you followed has expired that begins “but I already increased the upload limit” is this pairing. The manual says plainly that the post ceiling must be larger than the upload ceiling, and that instruction is the one most often half-followed.

    Reading Your Own Limits Before You Change Anything

    Before changing a ceiling because the link you followed has expired appeared, find out what your site is actually running, because a configuration file is a claim and the running process is the fact. WordPress already collects these values for you: Tools, then Site Health, then the Info tab, then the Server panel lists the post size, the upload size, the memory ceiling and the time limit as PHP reports them at that moment. That panel is worth more than any php.ini you can find, because it reflects the file that won. Shared accounts commonly have three or four candidate configuration files in play — a global one, a per-account one, a per-directory one — and only one of them is in force.

    The Number the Media Library Shows, and What It Leaves Out

    Under every WordPress uploader is a line reading “Maximum upload file size”, and it is more honest than people assume and still not sufficient. Core computes it by taking the smaller of the two ceilings, so a site with a sixty-four megabyte upload allowance and an eight megabyte post allowance correctly advertises eight. What the number cannot account for is everything else in the envelope. A 7.9 megabyte archive under an 8 megabyte ceiling still fails, because the referring URL, the action field, the security token and the rest of the form are in the request too, and the total is what gets measured. Treat that figure as an upper bound with no headroom rather than a guarantee.

    Matching the Symptom to the Limit

    Three questions separate the four causes, and they take about thirty seconds. How large was the thing you were sending? A large archive that fails the instant you press the button is the post ceiling, every time. Was the form small but crowded — a menu with two hundred items, a product with eighty variations, a page-builder layout — and did it fail on save rather than on upload? That is the field-count ceiling, not the size ceiling. Had the page been sitting open since yesterday? That is the one case where the link you followed has expired means what it says, and reloading the page genuinely fixes it.

    How to Fix the Link You Followed Has Expired on cPanel Shared Hosting

    Two values, one screen, about a minute, and the link you followed has expired stops for good. In cPanel, open the Software section and choose MultiPHP INI Editor, switch it to the domain you are fixing, and set post_max_size one step above upload_max_filesize — 64M and 48M, say, for a theme bundle that unpacks to forty-odd megabytes. Leave memory_limit above both. Save, then re-run the upload from a freshly loaded page rather than refreshing the failed one, because the failed screen is a dead end with a spent token in it. Sites on a plan with a PHP selector can make the same change there; the values and their relationship are identical either way.

    Why functions.php and .htaccess Advice Usually Fails

    Most of the fixes you will find online for the link you followed has expired change the two limits that were never the problem, and the PHP manual explains why in a single column of a table. Both post_max_size and upload_max_filesize are marked as per-directory settings, which means PHP reads them as the request starts, before your theme or any plugin has loaded. A call to change them from inside your site therefore runs long after the decision was made. Meanwhile memory_limit and max_execution_time are marked as changeable anywhere, which is exactly why they are the two every tutorial tells you to put in your theme file: they are the two that appear to work. As for php_value lines in .htaccess, those are honored only when PHP runs as an Apache module, and on a modern cPanel server it usually does not — the line is either ignored or throws a server error.

    This is the part we take off your hands. Every AHosting shared plan ships with a PHP configuration whose ceilings already agree with each other, so the pairing that causes the link you followed has expired is not one you inherit from us and then have to discover. The editor is there when you want a larger ceiling for a particular site, and support will set it for you if you would rather not. What we will not do is quietly raise every limit to a number that looks generous on a feature list, because two of the four are safer left where they are.

    When the File Size Is Not Why the Link You Followed Has Expired

    Small files fail too, and when they do the PHP ceilings are innocent. Three other causes produce the identical sentence, they are told apart by circumstance rather than by the message, and each has its own fix. None of them is helped by editing an upload limit, which is why a reader who has already raised every ceiling and still sees the error is usually looking at one of these.

    A Genuine Expiry: the Twelve-to-Twenty-Four-Hour Window

    Sometimes the message is simply true. WordPress tokens are tied to a tick counter that advances every twelve hours, and a token stays valid for the current tick and the one before it, which makes the real lifetime variable between twelve and twenty-four hours depending on when it was minted. Leave the post editor open overnight and press update in the morning and you will meet the error honestly earned. Reloading the page issues a fresh token and the problem goes away, which is the behavior that makes everyone think a reload is the general fix. It is the fix for this cause only.

    A Cached Page Serving Somebody Else’s Token

    Full-page caching and security tokens are a bad pairing, and the failure looks like the upload case with none of the same causes. If a page carrying a form is stored by a page cache and served to the next visitor, the token in that stored copy was minted for a different person in a different time window, and verification fails on arrival. The tell is that the error follows the page rather than the file: small forms break as readily as large ones, and the same page fails repeatedly until the cache entry rolls over. Exclude login, registration, checkout, cart and the admin area from full-page caching and the class of failure disappears. Our guide to reading a 508 resource limit error covers the related case where caching rules and resource ceilings interact.

    Too Many Fields: max_input_vars on Menus and Page Builders

    Crowded forms hit a different ceiling and it does not care how big they are. PHP counts incoming variables as well as measuring bytes, and the max_input_vars directive caps that count at one thousand by default, issuing a warning and truncating every variable past the limit. A navigation menu with two hundred items sends five or more fields per item; a variable product in a large catalog can send several hundred on its own. When the security token is late in the form it is among the variables thrown away, and you get the same sentence. Stores in that position are exactly who our WooCommerce plans are configured for. Raise this one only to what the form needs: the limit exists to blunt a denial-of-service technique built on hash collisions, so an arbitrarily large value is a real trade rather than a free win.

    What the Ceilings Look Like on AHosting Shared Plans

    Ceilings are arithmetic, and the link you followed has expired is what you see when two of them disagree, but what happens after they let the file through is a different matter. Once the archive is accepted it has to be written to a temporary directory and then unpacked, and both of those are disk writes against the account’s allowance rather than anything PHP decides. The map below is built from the LVE package configuration read on 2026-09-09 — the container memory ceiling and the disk write allowance each shared package actually carries — with the write time for two common archive sizes derived from it. No competitor publishes these, and we publish them because a reader part way through this problem deserves to know whether the next thirty seconds of apparent hang is normal.

    Shared planContainer memory (LVE PMEM)Disk write allowance48 MB archive: land and unpack96 MB archiveConcurrent PHP workers
    W Bronze2 GB10,240 KB/sabout 9.6 sabout 19.2 s30
    W Silver3 GB20,480 KB/sabout 4.8 sabout 9.6 s40
    WooStart3 GB20,480 KB/sabout 4.8 sabout 9.6 s40
    W Gold4 GB30,720 KB/sabout 3.2 sabout 6.4 s50
    AHosting Upload Budget Map — container and disk figures read from the LVE package configuration on 2026-09-09. Write times cover the archive landing in the temporary directory plus one unpacking pass, and are a floor rather than a promise.

    Reading the Memory Column Before You Raise memory_limit

    Read the memory column before touching memory_limit. The container ceiling is the one that applies, so setting a PHP memory value above it achieves nothing whatsoever — the request is stopped by the container long before PHP reaches its own number. Our write-up of WordPress memory limit errors covers that relationship in full. The worker column matters for a different reason: an upload occupies one worker for its whole duration, so a slow archive on a busy site is one fewer process available to serve everybody else while it runs.

    Upload Headroom Calculator

    Pick the size of the archive you are trying to install and the plan the site sits on. The tool reports the two ceilings that have to agree before the upload can land, and how long the write itself takes at that plan’s disk allowance.

    —

    Set the post ceiling to:

    Set the upload ceiling to:

    What the plan contributes:

    What to leave alone:

    Write times are derived from the LVE disk allowance recorded for each package on 2026-09-09 and cover the archive landing in the temporary directory plus one pass to unpack it. They are a floor, not a promise: a slow connection, a busy neighbor or a plugin that rewrites files during activation all add to it. The ceilings are arithmetic and apply on any host, not only ours.

    See how our WordPress plans are configured

    When a Shared Plan Is Genuinely the Wrong Place for This

    Occasionally the honest answer is that the ceiling is not the obstacle. A site that installs hundred-megabyte archives regularly, runs a build step on the server, or needs a php.ini nobody else shares has outgrown the arrangement where limits are set per domain inside a panel, and at that point a VPS stops being an upsell and starts being the cheaper option. That is a small minority of the people who arrive at this error, and it would be dishonest to pretend otherwise: for almost everyone, two values on one screen is the entire story.

    A Practical Checklist Before You Touch Any PHP Setting

    Work down this list in order and stop at the first line that matches, and the link you followed has expired will have named its own cause before you reach the end. Each step is reversible, none requires a support ticket, and the order is chosen so that the cheapest checks eliminate the most common causes first.

    The Nine Checks, in the Order That Costs You Least

    1. Reload the page from the menu rather than refreshing the failed screen, then retry once. If it succeeds, the token had genuinely aged out and there is nothing to configure.
    2. Note the size of the file. Anything above eight megabytes on stock PHP settings is the post ceiling, and you can skip to step 6.
    3. Open Tools, Site Health, Info, Server and write down the live values for the post size, upload size and memory ceiling. Configuration files can disagree; this panel cannot.
    4. Compare the two size ceilings. If the upload ceiling is equal to or larger than the post ceiling, that pairing alone explains the failure.
    5. If the file was small and the form was crowded, count the fields instead. Menus over roughly a hundred and fifty items and products with many variations are the usual suspects.
    6. In cPanel, open Software and then MultiPHP INI Editor, select the domain, and set the post ceiling one step above the upload ceiling. Save.
    7. Retry from a freshly loaded page. Confirm the new value in Site Health rather than assuming the save applied to the domain you meant.
    8. If it still fails, disable full-page caching for the admin area and retry once more before changing anything else. A cached form is the cause that survives every limit you raise.
    9. Only then consider the field-count ceiling, and raise it to what the form needs rather than to a round number.

    Change One Value at a Time, and Re-Test Between Each

    One habit is worth more than the whole list: change one value at a time and re-test. Raising four limits at once and finding that the upload works tells you nothing about which one mattered, and two of the four are ones you would rather put back. Sites running an older PHP branch have a second variable in play as well, and our comparison of PHP versions on cPanel covers which defaults changed where. If the dashboard is also showing Site Health warnings you have not investigated, the write-up of the active PHP session notice explains another entry on the same screen that is routinely misread.

    Frequently Asked Questions About the Link You Followed Has Expired

    Why does my WordPress theme upload say the link you followed has expired?

    Typically because PHP threw the upload away before WordPress ever read it. The browser sends your theme zip and every hidden form field in one request body, and when that body is larger than the post size ceiling, PHP empties both of the arrays the form arrived in rather than trimming the file out of them. WordPress then looks for the security token that was in the same body, cannot find it, and prints the only sentence it has for a token that failed. Nothing expired and nothing timed out, so raising the upload ceiling alone will not help.

    Is the link you followed has expired a real error in 2026 or a browser glitch?

    Specifically it is a real server-side refusal, and treating it as a browser problem is why people lose an afternoon to it. The sentence comes from WordPress core, not from the browser, and it is printed by the function core calls whenever a form arrives without a token it can verify. Clearing your cache, using a private window and pressing the back button all leave the cause untouched, because the cause is a limit in your PHP configuration. The only case where a refresh genuinely helps is the one where the token really had gone stale in an old tab.

    post_max_size vs upload_max_filesize: which one causes this message?

    In practice the post size ceiling causes it and the upload ceiling almost never does, and the wording of the failure is what separates them. When a file is larger than the upload ceiling, WordPress catches it politely and says the file exceeds a directive in php.ini, with the page still rendering around the notice. When the whole request body is larger than the post ceiling, PHP discards the body first and WordPress never gets far enough to be polite. So the message you are reading is itself the diagnostic.

    How do I fix the link you followed has expired on AHosting shared hosting?

    Fortunately this is one of the few WordPress problems with a fix that takes about a minute, and every AHosting shared and WordPress plan ships the tool for it. Open the PHP INI editor in cPanel, raise the post size ceiling so that it sits comfortably above the upload ceiling, and keep the memory ceiling above both. Adding lines to your theme functions file will not work for these two values, because PHP has already read them by the time your theme loads. Re-run the upload rather than refreshing the failed screen.

    Why does the link you followed has expired mention expiry at all?

    Notably because core cannot tell the difference between a token that went stale and a token that never arrived. Both paths end in the same function and that function has one sentence for both, so it picks the friendlier explanation and prints it. Tokens really do age out after somewhere between twelve and twenty-four hours, which is why the wording is right often enough to survive. On an upload it is simply wrong, and the wrongness is what sends people to cache plugins and browser settings instead of to their PHP limits.

    Editing functions.php vs the PHP INI editor: why does one of them fail?

    By contrast with the memory and execution limits, the two limits that matter here cannot be set from inside your site at all. PHP marks them as per-directory values, which means the parser reads them when the request starts, before any theme or plugin file is loaded, so a call to change them from a theme runs far too late to have any effect. The limits most tutorials tell you to raise in that file are the two that can be changed there, and neither is the one causing this. That mismatch is why the advice looks reasonable and still does nothing.

    Does the link you followed has expired mean AHosting limits are too low in 2026?

    Indeed it usually means the opposite, which is worth knowing before anyone changes plans over it. The message appears most often when an upload ceiling has been raised generously and the post ceiling was left at its stock value, so the two no longer agree with each other. A container with four gigabytes of memory will refuse a nine megabyte theme just as readily as a small one if that pairing is wrong. What the plan tier genuinely governs is how fast a large archive lands and unpacks once the ceilings let it through.

    Can a cache plugin cause this WordPress security token failure by itself?

    Consequently yes, and this is the variant that survives every PHP change you make. A full-page cache that stores a page containing a form will serve that stored copy, security token included, to whoever asks for it next, and a token minted for one visitor in one time window is not valid for another. The give-away is that the failure follows the page rather than the file size, and that small forms fail as readily as large ones. Excluding login, checkout, admin and any form-bearing page from the cache resolves it.

    How do I tell which limit broke when the link you followed has expired appears on AHosting?

    Above all, read the size of the thing you were sending before changing anything. A large archive that fails instantly points at the post size ceiling; a modest file that fails on a page with hundreds of fields points at the input variable ceiling; a form you left open overnight points at a genuinely stale token. Site Health lists the live values for each of these limits under its server panel, and that panel reflects what PHP is actually running rather than what a configuration file claims. Match the symptom to the limit first, then change exactly one thing.

    Will raising every PHP limit stop the link you followed has expired for good in 2026?

    Ultimately no, and two of those limits are actively worth leaving alone. The input variable ceiling exists to blunt a denial of service technique that abuses hash collisions, so setting it to an enormous number trades a rare inconvenience for a real exposure. Raising the memory ceiling past what the container allows achieves nothing at all, because the container ceiling is the one that applies. Raise the post size ceiling to fit the largest archive you genuinely install, leave a little headroom above it, and stop there.

    September 16, 2026
  • An Active PHP Session Was Detected: What WordPress Site Health Is Really Telling You, and How to Fix It on Shared Hosting

    An Active PHP Session Was Detected: What WordPress Site Health Is Really Telling You, and How to Fix It on Shared Hosting

    • What “An Active PHP Session Was Detected” Actually Means
      • Why WordPress Core Never Opens an Active PHP Session Itself
      • Why the Badge Says Performance and the Status Says Critical
    • What Actually Breaks: Your Own Cookie Comes Back at You
      • The Loopback Request Carries Your Session Cookie
      • Ten Seconds, Then the Test Reports a Failure
    • Why This Test Is Wrong About an Active PHP Session in Both Directions
      • It Only Sees the Request It Runs In
      • A Red Critical Can Be the Cheap Case
    • What an Active PHP Session Costs on Shared Hosting
      • One Lock, One Request at a Time
      • Entry Processes: Where Queueing Becomes a Ceiling
      • An Active PHP Session Makes the Page Uncacheable
    • Where PHP Session Files Actually Live
      • Reading Your Own Save Path Rather Than Guessing It
      • Why the Files Pile Up: One Per Cent Garbage Collection
    • Work Out What an Active PHP Session Costs Your Account
    • How to Fix an Active PHP Session Without Breaking What Needed It
      • Close It After the Last Write, Not at the End of the Request
      • Read-Only Pages Never Need the Lock at All
      • What Not to Do About an Active PHP Session Warning
    • A Practical Checklist for an Active PHP Session Warning
      • Where an Active PHP Session Stops Being Your Problem
      • Which Fix Fits Which Page
    • Frequently Asked Questions About an Active PHP Session
      • How do I clear a session variable in PHP?
      • Is an active PHP session a real problem in 2026, or just a warning?
      • What actually starts an active PHP session on a WordPress site?
      • How do I find what opens an active PHP session on AHosting shared hosting?
      • session_write_close vs session_destroy: which one should I actually call?
      • File sessions vs Redis sessions: does moving the store fix an active PHP session?
      • Does an active PHP session use up AHosting entry processes in 2026?
      • Why does the loopback request test fail whenever a session is open?
      • Can I safely ignore an active PHP session warning on AHosting hosting?
      • Will clearing an active PHP session speed up a WordPress site in 2026?
    TL;DR

    WordPress core never opens a PHP session, so an active PHP session on your site was opened by a plugin, a theme or a server directive. The cost is not the warning: PHP locks the session file for the whole request, so every other request from that visitor queues behind it, and the session cookie stops the page being cached at all. The fix is to close the session as soon as the last write is done — not to delete the code that needed it, and not to hide the test.

    WordPress core does not open one, which is the first useful thing to know. When Site Health reports an active PHP session, it has found that something in your installation called the function that opens a session, and that the session was still open when the screen rendered. Core keeps its own state in cookies, the options table and transients precisely so it never needs one, so a stock install with no third-party code cannot produce this entry. Something you installed did. The warning itself is mild, the wording is vague, and the actual cost is concurrency: while that session is open, PHP holds an exclusive lock on one file, and everything else that visitor asks for stands in line. This guide covers what the test really checks, why it is wrong in both directions, what the lock costs on a shared plan, and how to close it without breaking the feature that needed it.

    Listen: WordPress core never opens a PHP session, so the one on your site was opened by something you installed, and the cost is concurrency rather than correctness. By Matt Chrust, Director of Business Development, AHosting.

    What “An Active PHP Session Was Detected” Actually Means

    The test behind it is about ten lines long. Core asks PHP one question — is a session open right now — and if the answer is yes it changes a label, raises the status to critical, and prints a sentence telling you to close the session before making any HTTP requests. There is no plugin name in it, no file path, no line number, and no indication of how long the session has been open or what opened it. That is the whole test. You can read it yourself as the get_test_php_sessions method in the WP_Site_Health class, which core has shipped since version 5.5. Everything else people believe about an active PHP session — that it means a plugin is broken, that it slows the dashboard, that it is a security problem — is inference, and most of it is wrong. What it does mean is worth the rest of this page, because the sentence core prints describes the symptom and never the mechanism.

    Why WordPress Core Never Opens an Active PHP Session Itself

    Core made this choice deliberately and has stuck to it for over a decade. Logged-in state travels in authentication cookies, short-lived data goes in transients, and anything durable goes in the options or usermeta tables, none of which needs a file locked on disk for the length of a request. The practical consequence is that an active PHP session has a very short suspect list. If you see an active PHP session on a site, the code that opened it is a plugin, a theme, a must-use plugin, or a server-level directive that opens one automatically for every request before your code runs at all. That last case is the one people miss, because nothing in the site’s own files mentions sessions and the search that would have found the culprit comes back empty.

    Why the Badge Says Performance and the Status Says Critical

    Site Health entries carry two independent pieces of metadata, and this one pairs them oddly. The badge is the blue Performance label, which is what core chose to file the test under. The status, when a session is found, is critical — the same severity the screen uses for a site that cannot reach the update servers. Readers reasonably conclude that core is either overreacting or mislabelling, and then ignore it. Both halves are defensible once you know what an active PHP session does: the damage genuinely is a performance problem, and it genuinely is severe, because it removes the site’s ability to serve one visitor’s requests in parallel. The badge tells you the category and the status tells you the size. Neither tells you the cause.

    What Actually Breaks: Your Own Cookie Comes Back at You

    Core’s own wording says the session interferes with REST API and loopback requests, and stops there. The reason it interferes is specific, mechanical and absent from every page that ranks for this error. A loopback request is WordPress asking its own server for a page, which is how it verifies that scheduled tasks and the editor’s safety checks can work at all. We covered what that test does and how it fails on its own in the guide to the loopback request warning. What that guide does not cover, because it belongs here, is what happens when a session is open at the moment the loopback fires.

    The Loopback Request Carries Your Session Cookie

    Core builds that request with the line $cookies = wp_unslash( $_COOKIE ); and passes the result straight through. Every cookie the browser sent with the current admin request is forwarded to the inner request, and that includes the session cookie PHP set when the session opened. So the inner request does not arrive anonymous. It arrives holding the identifier of the session the outer request is currently sitting on. If the plugin that opened the session runs on that inner request too — and a plugin that opens one unconditionally will — PHP tries to take the same exclusive lock on the same file. The outer request has it, and will not give it up until it finishes.

    Ten Seconds, Then the Test Reports a Failure

    At this point the site is waiting for itself, and it will wait for exactly as long as core allows. The loopback timeout is hard-coded at ten seconds. The outer request cannot complete until the loopback answers; the loopback cannot answer until the outer request releases the lock. Ten seconds later the timeout expires, the loopback test records a failure, and you are looking at two red entries that are really one problem. That is why the loopback entry and the session entry so often appear together, and why fixing the loopback in isolation never works. The same pattern explains some cases of the secure connection failure, where the outbound call is made while a session is still open.

    Why the loopback test fails when a PHP session is open Step one: a plugin opens a session on the admin request, and PHP takes an exclusive lock on that visitor’s session file for the rest of the request. Step two: Site Health runs its loopback test, which posts to wp-cron.php and forwards every cookie from the current request, including the session cookie. Step three: the inner request matches the same session and calls for it, so it waits for the lock. Step four: the outer request cannot release the lock until it finishes, and it cannot finish until the loopback returns, so the inner request waits out the ten-second timeout and the test reports a failure that the site inflicted on itself. The site waits for a lock it is holding itself. The loopback test forwards your cookies, so the inner request lands on the same session file. 1. Session opens A plugin opens a session on the admin request, and PHP locks that session file 2. The test calls home Site Health posts to your own server and sends every cookie 3. The inner request waits Same session, same file, and the lock is already taken 4. Neither side can move The outer request cannot release the lock until it finishes, and it cannot finish until the loopback answers. 5. Ten seconds, then a failure Core allows the loopback ten seconds. The screen then reports a loopback problem, which is the symptom. Closing the session before any outbound request breaks the loop at step 3. That is the same instruction core prints, and the reason it prints it is not in the message.

    Why This Test Is Wrong About an Active PHP Session in Both Directions

    Here is the part that changes how you should read the screen. The session test is registered as a direct test, meaning it executes inside the PHP process that is building the Site Health page, at the moment you load it. It is not a background job and it does not sample anything. It asks one question about one request — the one it is inside. Everything that follows from that is a limitation nobody documents, and it cuts both ways. A site can show a clean screen while paying the full cost on every visitor, and a site can show a red critical for something that costs it almost nothing.

    It Only Sees the Request It Runs In

    Consider a plugin that opens a session on the front end and not in the dashboard, which is by far the most common shape for form handlers, cart add-ons and tracking code. When you open Site Health, that code does not run, no session is open in the admin request, and the test reports that no PHP sessions were detected. The screen is clean. Every visitor to the site is still queueing behind a lock on every page. Nothing on the Site Health screen will ever tell you so, and no amount of re-running it will change the answer, because the request it inspects is not the request with the problem.

    A Red Critical Can Be the Cheap Case

    Now invert it. A plugin that opens a session only inside wp-admin trips the test reliably, because the session is open in exactly the request the test runs in. That is the version everyone sees and the version every forum thread is about. It is also, in cost terms, the mild one: dashboard pages are uncacheable anyway, the audience is you and your editors, and the concurrency lost is concurrency nobody was using. The visible warning and the expensive problem are, in other words, close to uncorrelated. Read the code, not the badge.

    What an Active PHP Session Costs on Shared Hosting

    Three separate costs stack up behind an active PHP session, and only the first is about PHP at all. The lock serializes a visitor’s requests, the queued requests occupy concurrency the account is metered on, and the session cookie removes the page from the cache that was protecting both. Each is modest alone. Together they turn a page that cost nothing into a page that costs a worker and holds it.

    One Lock, One Request at a Time

    PHP’s default session store is files on disk, and the manual is blunt about what that means: session data is locked to prevent concurrent writes, so only one script may operate on a session at any time. Underneath, that is an exclusive advisory lock on the session file, and the flock system call documents the consequence precisely — only one process may hold an exclusive lock on a file at a time, and a call may block if an incompatible lock is already held. Blocking is the whole story. The second request does not fail and does not fall back; it waits, holding a PHP worker while it does nothing.

    Entry Processes: Where Queueing Becomes a Ceiling

    This is where a shared plan stops being an abstraction. Entry processes are the account’s ceiling on simultaneous PHP execution, and our shared plan pages publish the number for each tier along with the sentence that matters most here: it is a limit, not a reservation, and cached pages are served without consuming one. A request waiting on a session lock is not cached and is not idle from the ceiling’s point of view. It is a worker, occupied, achieving nothing. Push enough of them into the queue at once and the account stops accepting new work, which is the same wall described in the guide to the 508 resource limit error.

    Shared planEntry processes publishedRequests that can run at once, account-wideRequests that can run at once for one visitor holding a session lock
    W Bronze / WP Bronze30301
    W Silver / WP Silver / WooStart40401
    W Gold / WP Gold50501
    Any plan, page served from cachenot countednot countednot applicable
    AHosting Session Lock Concurrency Map — entry-process figures as published on the AHosting shared and WordPress plan pages, September 2026. The right-hand column is not a plan limit: it is what an exclusive file lock permits, and it is one on every plan, which is why buying a larger plan does not fix this.

    An Active PHP Session Makes the Page Uncacheable

    Opening a session sets a cookie, and a cookie changes how every cache in the path treats the response. Caches do not agree on the rule, which is itself the problem: Apache Traffic Server documents cookied-content caching as a configurable policy with several possible settings, and a full-page cache in front of WordPress typically takes the conservative option and declines to serve a cached copy. On our stack, a cached page consumes zero entry processes; a page carrying a session cookie does not get to be that page. The cost is therefore not one slow request. It is the loss of the mechanism that was keeping most requests off PHP entirely, which is also what makes the writes described in our guide to disk I/O throttling climb.

    Where PHP Session Files Actually Live

    People ask this second, right after asking what opened the active PHP session, and the honest answer starts with a setting rather than a path. PHP writes sessions wherever session.save_path points, and the session configuration reference lists that directive with an empty default, which means the build decides. On a cPanel account the path is set for you and is usually a per-version directory outside your home folder, so you will not find the files by browsing the File Manager. The same reference records three other defaults worth knowing: the cookie is named PHPSESSID, the handler is files, and data is treated as garbage after 1440 seconds.

    Reading Your Own Save Path Rather Than Guessing It

    Guessing is what costs people the afternoon, because the answer differs by control panel, by PHP version and sometimes by account. The reliable way is to ask the PHP that is actually running your site, which every AHosting plan lets you do two ways: a one-line info page, or the command line through the jailed shell that ships with every shared plan. Read the value of the save path directive there and you have the real answer for the version currently selected. Switch PHP version and check again, because each installed version keeps its own configuration and can be pointed somewhere else entirely.

    Why the Files Pile Up: One Per Cent Garbage Collection

    Session files are not deleted when a visitor leaves. PHP clears them opportunistically, and the default odds are published in the same reference: a garbage collection probability of one against a divisor of one hundred, which is a one per cent chance of a cleanup pass on any given request. Busy sites therefore accumulate small files steadily, and each one is a real file consuming a real inode. On a plan with a published inode allowance that matters, and it is the same accounting described in our guide to the WordPress inode limit. Many managed stacks replace the probabilistic sweep with a scheduled job for exactly this reason.

    Work Out What an Active PHP Session Costs Your Account

    The numbers above are ceilings and defaults. What you want is the cost on your account, with your plan, for the way your site opens its session. Set the three controls and the calculator gives you what an active PHP session costs in wall-clock time, the share of your concurrency it occupies, whether Site Health can see the problem at all, and the first thing to change.

    Session Lock Concurrency Calculator

    Say where the session is opened, how long the request that holds it runs, and which plan the account is on. It works out what the lock costs in wall-clock time, how many entry processes are tied up while that happens, whether Site Health can even see the problem, and what to do first.

    —

    What the lock costs:

    What it does to the cache:

    Whether Site Health can see it:

    Do this first:

    The arithmetic assumes four overlapping requests from one visitor, which is ordinary for a page with a cart fragment, an autosave and a tracking call. It models PHP file-based sessions, where an exclusive lock is held for the whole request. It cannot see your code, so confirm against the plugin before changing anything.

    How to Fix an Active PHP Session Without Breaking What Needed It

    Almost every ranking page for an active PHP session says the same thing: find the plugin and delete the line that opens the session. That advice breaks working features, because the code opened a session for a reason and something later in the request reads it. The supported fix is smaller and safer. Keep the session, and close it the moment the last write is done, which releases the lock while leaving the data intact for the next request.

    Close It After the Last Write, Not at the End of the Request

    Closing the session explicitly writes the data back and releases the lock, and PHP is clear that this is what the call is for. Placement is the part that decides whether it helps. A close call on the last line of a plugin file releases the lock a millisecond before the request would have released it anyway, which is worth nothing. The call belongs immediately after the final write to the session — before the template renders, before any outbound HTTP call, and before anything that might take time. Frameworks treat this as ordinary practice: Symfony documents that the native handlers lock while its Redis and Memcached handlers do not, and tells you to pick deliberately.

    Read-Only Pages Never Need the Lock at All

    Many pages read from the session and never write to it: a header that greets the visitor by name, a template that checks whether a wizard was completed, a widget showing a saved preference. For those, PHP offers a mode that opens the session, reads it and closes it in one step, taking no lasting lock. It is the read_and_close option, and the manual describes it as avoiding unnecessary locking when the session data will not change. Applied to the read-only two-thirds of a typical plugin’s pages, it removes the contention without touching a single feature.

    What Not to Do About an Active PHP Session Warning

    • Do not delete the session code blind. Something reads it, and the failure will surface somewhere unrelated, days later.
    • Do not reach for a plugin that hides the Site Health entry. The lock does not care whether you can see the warning.
    • Do not destroy the session where you meant to close it. Destroying throws away a cart or a part-completed form; closing keeps the data and releases the lock.
    • Do not turn on the directive that starts a session automatically for every request. It guarantees the cost on every page including the ones that never needed it.
    • Do not assume a network-backed store is a free upgrade. Valkey and the Redis-protocol stores remove the file lock, but a handler that does not lock lets two requests overwrite each other, which is a different bug and a quieter one.
    • Do not benchmark the fix on a quiet staging copy. Laravel allows concurrent same-session requests by default for the same reason the problem is invisible there: with one tester, nothing overlaps.

    A Practical Checklist for an Active PHP Session Warning

    1. Read whether the session is opened on the front end or only in wp-admin. That single fact decides whether this is costing you visitors or costing you nothing.
    2. Bisect the plugins with Site Health open, and check the theme as well. Theme frameworks that predate the REST API are a common source.
    3. Search the codebase for the call that opens a session before bisecting, if you have shell access. It is usually faster than halving the plugin list.
    4. Rule out a server-level automatic start before blaming your code, because that setting leaves no trace in the files you are searching.
    5. Add the close call immediately after the last write, then re-run Site Health and the loopback test together. Both should clear at once.
    6. Switch the read-only paths to open-read-and-close, which is where most of the remaining contention lives.
    7. Confirm the page is cacheable again afterwards. If the cookie is still being set on every request, the concurrency fix landed and the cache fix did not.

    Where an Active PHP Session Stops Being Your Problem

    None of that needs a support ticket on an AHosting account, and that is deliberate. Our WordPress plans include selectable PHP versions, WP-CLI and a jailed shell so that the person reading a warning can act on it in the same sitting. The part we take off your hands is the layer underneath: LiteSpeed and LSCache keeping the pages you fixed out of PHP altogether, and CloudLinux holding the account’s concurrency steady while you work. Where a store is the thing queueing, the WooCommerce plans start at the larger allocation for exactly that reason, and where a single account can no longer be made to fit, a VPS is the honest next step rather than a bigger shared plan. The lock is yours to release; the headroom around it is ours.

    Which Fix Fits Which Page

    What your code does with the sessionThe call that fitsWhat it costs youWhat it does not fix
    Reads a value, never writesOpen with read and close in one stepNothing. The read still worksThe Site Health entry, if another page still holds a session open
    Writes once, early in the requestClose immediately after that writeOne line, placed deliberatelyA second plugin opening its own session later in the same request
    Writes throughout the requestClose after the last write, then re-open only if a later write is unavoidableA short audit of where the writes areThe cookie, which keeps the page out of the cache either way
    Opens a session it never usesRemove the call, after confirming nothing reads itA bisect to prove nothing reads itNothing. This is the one case where deletion is correct
    Which fix fits which page — the four shapes a session-using request takes, and the call that suits each. The right-hand column is the one people skip: no single change here clears the warning if a second component is still holding a session open.

    Frequently Asked Questions About an Active PHP Session

    How do I clear a session variable in PHP?

    Typically people arrive at that question from the wrong end of this problem, so it is worth separating the two things it can mean. Removing one value is a single unset call against the session superglobal, and removing all of them is a session destroy call, but neither of those releases the lock that Site Health is complaining about. The lock is held from the moment the session opens until the request ends or the session is explicitly closed, so clearing values inside it changes nothing about concurrency. If what you actually want is for other requests to stop queueing, the call you need closes the session rather than emptying it.

    Is an active PHP session a real problem in 2026, or just a warning?

    Specifically it is a real problem, and the reason the wording feels overblown is that core files it under a Performance badge while marking it critical. The cost is concurrency: a request holding the session file holds it exclusively, so every other request from that same visitor waits its turn rather than running alongside. On a laptop with one tester that is invisible. On a shared plan with a checkout, a cart fragment and two dashboard polls firing together, it is the difference between one round trip and four stacked end to end.

    What actually starts an active PHP session on a WordPress site?

    In practice a plugin or a theme does, because WordPress core never calls the function that opens one. Core keeps its own state in cookies, the options table and transients precisely so it does not need PHP sessions, which is why a stock install with no third-party code cannot produce this warning. The usual sources are older form and booking plugins, membership and quiz add-ons, some analytics and affiliate trackers, and theme frameworks that predate the REST API. A server-level directive that opens a session automatically for every request can do it too, and that one is invisible in your code.

    How do I find what opens an active PHP session on AHosting shared hosting?

    Fortunately this is one of the few WordPress problems with a genuinely reliable bisect, and every AHosting plan ships the two tools it needs. Deactivate plugins in halves from the dashboard, re-running Site Health after each pass, and the warning appears and disappears with the responsible one. The faster route is a search of the code itself, because the function that opens a session is short and distinctive, and a jailed shell plus WP-CLI is included on every shared and WordPress plan. A theme is worth checking last and worth checking anyway, since theme frameworks are a common source.

    session_write_close vs session_destroy: which one should I actually call?

    By contrast with each other these two do almost opposite things, and only one of them is the answer here. Closing the session writes what is in memory back to the file, releases the lock and leaves the data intact for the next request, which is what you want after the last write on a page. Destroying it deletes the stored data entirely and is what you want at logout, not at the end of a page render. Reaching for destroy to clear a warning throws away a shopping cart or a multi-step form part way through, and the warning comes back on the next page anyway.

    File sessions vs Redis sessions: does moving the store fix an active PHP session?

    Notably it fixes the file lock and not the warning, which is a distinction worth understanding before anyone spends money on it. Site Health tests whether a session is open at all, not where the data lives, so the entry stays exactly as it is. What changes is the concurrency cost, because a network-backed handler usually does not lock, so parallel requests stop queueing. That is also the trade: without locking, two requests writing to the same session can overwrite each other, which is why some handlers ship locking off by default and treat it as a choice rather than a bug.

    Does an active PHP session use up AHosting entry processes in 2026?

    Indeed it does, twice over, and that is the part the warning never mentions. A request waiting on a session lock is not idle from the account’s point of view: it is a live PHP worker doing nothing, and it counts against the entry process ceiling exactly as a working request does. The second cost is worse, because a session cookie makes a page ineligible for full-page caching, and a cached page is served without consuming an entry process at all. So starting a session converts free cached hits into counted workers and then makes those workers queue.

    Why does the loopback request test fail whenever a session is open?

    Consequently the two entries fail together often enough that people treat them as one problem, and mechanically they are. The loopback test asks your own server for a page and forwards the current request cookies with it, session cookie included, so the inner request lands on the same session as the outer one. If the code that opened the session runs again on that inner request, it waits for a lock the outer request is still holding and cannot release until it finishes. Core gives that inner request ten seconds, and ten seconds later the test reports a failure that is really a self-inflicted wait.

    Can I safely ignore an active PHP session warning on AHosting hosting?

    Ultimately that depends on one thing, and it is not the badge color. If the session is opened only in the admin area by a plugin that genuinely needs it, the cost is confined to your own dashboard and ignoring it is defensible. If the same code runs on the front end, the site is paying for it on every visitor, every request, whether or not anyone ever opens Site Health. The screen cannot tell you which of those you have, because it only sees the request it ran in, so the answer comes from reading the code rather than reading the warning.

    Will clearing an active PHP session speed up a WordPress site in 2026?

    Interestingly it rarely improves a single page load and often transforms the site under load, which is why benchmarks on a quiet staging copy mislead people here. One request on an idle server is no faster for having released a lock nobody was waiting on. The gain arrives when several requests overlap: a cart update alongside a fragment refresh, an editor saving while an autosave fires, a crawler and a visitor hitting the same account together. Closing the session early lets those run side by side instead of end to end, and letting pages cache again removes them from the count entirely.

    September 15, 2026
  • One or More Recommended Modules Are Missing: How to Read the WordPress Site Health Warning and Fix It on Shared Hosting

    One or More Recommended Modules Are Missing: How to Read the WordPress Site Health Warning and Fix It on Shared Hosting

    • What "One or More Recommended Modules Are Missing" Actually Means
      • Why Site Health Says Recommended Modules Are Missing Rather Than Broken
      • Why the Module Names Do Not Match Anything You Can Install
    • The Fallback Chain Behind the Recommended Modules Are Missing Warning
      • The WordPress PHP Module Fallback Chain
      • When a Warning Silently Becomes a Critical
      • The Two Modules Site Health Can Never Warn You About
    • What Each Missing Module Actually Costs You
      • The AHosting PHP Module Impact Ladder
      • imagick Is the One With a Memory Bill
      • intl Is the One a WooCommerce Store Should Care About
    • The Handbook the Warning Links To Disagrees With the Warning
    • How to Fix Recommended Modules Are Missing on an AHosting cPanel Plan
      • What to Do When the Module Is Not in the List
      • Why Enabling Every Module Is the Wrong Instinct
    • Decode the Module Named in Your Warning
    • A Practical Checklist for Clearing Recommended Modules Are Missing
    • Frequently Asked Questions About Missing WordPress PHP Modules
      • What does the "The optional module, imagick, is not installed or has been disabled" warning mean in WordPress?
      • Can a WordPress site run normally when recommended modules are missing in 2026?
      • What should I do first when Site Health reports recommended modules are missing?
      • imagick vs gd: which one matters more when recommended modules are missing?
      • intl vs mbstring: which missing PHP module breaks more on a WooCommerce store?
      • Can I fix recommended modules are missing myself on AHosting shared hosting?
      • Does AHosting enable imagick by default, and how do I check it in 2026?
      • Why does the recommended modules are missing warning come back after a PHP version change?
      • Will clearing recommended modules are missing speed up an AHosting WordPress site in 2026?
      • Is libsodium missing from Site Health a problem I should be worried about?
    TL;DR

    Site Health tests twenty PHP modules and marks only two of them required, so a heading saying recommended modules are missing is almost always a quality ceiling rather than a fault. Read the module names under it, not the heading. Four of those modules are fallbacks for other modules, and a missing fallback is the one case that turns the warning into a red critical — which is why the same screen can go from yellow to red without anything new breaking.

    Site Health puts a blue Performance badge beside it, which makes it read like a speed problem, and it is not one. When WordPress reports that one or more recommended modules are missing, it has finished a test that walks a fixed list of PHP extensions and records which ones your server did not load. Almost every entry on that list is optional by design, so the heading is a statement about the ceiling your PHP build puts on WordPress rather than a fault report. The useful information is in the module names printed underneath it, and in one rule about fallbacks that decides whether this stays a yellow warning or turns red. This guide covers both, and what to do about each module on a cPanel account.

    Listen: Site Health tests around twenty PHP modules and marks only two of them required, which is why this warning is a ceiling rather than a fault. By Matt Chrust, Director of Business Development, AHosting.

    What “One or More Recommended Modules Are Missing” Actually Means

    The heading is generated, not written. Core keeps a list of roughly twenty PHP modules, tests for each one in turn by looking for a function, a class, a constant or a loaded extension, and collects a line for every module it cannot find. If the collection is empty, the test reports that required and recommended modules are installed. If it is not empty, the heading changes to say that recommended modules are missing, or something stronger. So the sentence you are reading was assembled from whatever failed, and it will say exactly the same thing whether one module is absent or nine are. The color of the badge and the list beneath it are the only parts that vary. Site Health is worth reading this way generally: its other entries, like the loopback request test, behave the same way and are equally often misread as outages.

    Why Site Health Says Recommended Modules Are Missing Rather Than Broken

    Core marks only two of the modules it tests as required: the hashing extension and the JSON extension. Everything else in the list is flagged optional. That distinction is not cosmetic, because it changes the status the whole test returns. An optional module that is absent sets the status to recommended, which is the yellow badge and the wording you are looking at. A required module that is absent sets the status to critical, which is red and a different heading entirely. A site that can boot far enough to render the Site Health screen has both required modules by definition, since WordPress cannot run without either of them. In other words, the yellow version of this warning is the only version most people will ever see, and it can never by itself mean the site is broken.

    Why the Module Names Do Not Match Anything You Can Install

    When recommended modules are missing, two of the entries are named after the array key core uses internally rather than after the PHP extension you would go and enable, and both of them waste people an afternoon. The first is mod_xml, which tests for the libxml extension; searching for a PHP extension called mod_xml returns nothing because there is no such extension. The second is libsodium, which tests for a constant belonging to the extension PHP calls sodium. Search the libsodium project documentation and you will find a C library, not a checkbox. Both translations matter in the one place they are used, the extension list in cPanel, where your account sits isolated under CageFS with its own PHP configuration. Look for libxml and for sodium; the names Site Health prints are not the names the interface uses.

    Why the same Site Health test turns from yellow to red WordPress checks imagick. If imagick is missing, core checks whether its declared fallback, gd, is present. If gd is present, the test records one optional-module warning and the heading reads that one or more recommended modules are missing. If gd is also missing, core promotes gd from optional to required for this run, the test status becomes critical, and the heading changes to say that required modules are missing. Nothing else about the site has changed. One missing module is yellow. Two can be red. A fallback is only tested when the module it covers has already failed, and then it counts as required. 1. Core checks imagick Marked optional in the list of modules it tests 2. It is not loaded One warning line is recorded, naming imagick 3. Now gd is checked Its declared fallback, tested only because imagick failed gd is present Status stays at recommended. The heading reads that recommended modules are missing. Images still resize. gd is missing too Core promotes gd to required for this run. Status becomes critical and the heading says required, not recommended. Four modules behave this way: gd, mcrypt, simplexml and xmlreader, plus zlib behind zip. A fallback that is present is never mentioned at all, so it cannot be read off the screen.

    The Fallback Chain Behind the Recommended Modules Are Missing Warning

    Five of the modules in the list are not tested on their own terms at all. Each one is declared as a fallback for another module, and core handles them with a rule that is easy to state and almost never stated: a fallback is examined only if the module it covers has already failed. If the primary module is present, the fallback is skipped entirely and can never appear in the warning, whether or not it is installed. If the primary module has failed, the fallback is examined and, for the duration of that check, it is treated as required rather than optional. One rule, two consequences, and the second one is the reason a screen reporting that recommended modules are missing sometimes turns red without anything new having gone wrong.

    The WordPress PHP Module Fallback Chain

    Read from WordPress core on 2026-09-14. Whenever recommended modules are missing, each row here is a pair core will never report together in the ordinary case, because the second column is invisible while the first column is healthy.

    Module core tests firstIts declared fallbackIf only the first is missingIf both are missing
    imagickgdOne optional line. Status stays recommended.gd is promoted to required. Status becomes critical.
    zipzlibOne optional line. Status stays recommended.zlib is promoted to required. Status becomes critical.
    mod_xml (tests libxml)simplexml and xmlreaderOne optional line. Status stays recommended.Either fallback missing promotes it to required. Status becomes critical.
    libsodium (tests sodium)mcryptNothing is reported on PHP 7.2 or newer.Nothing is reported on PHP 7.2 or newer.
    The WordPress PHP Module Fallback Chain, read from core source on 2026-09-14. A fallback that is present is never named, so it cannot be read off the Site Health screen.

    When a Warning Silently Becomes a Critical

    Picture a site with gd and without imagick, which is an extremely common shape. It reports that recommended modules are missing, names imagick, and everything works. Now the account is moved to a newly installed PHP version where neither image library has been enabled yet. Core tests imagick, fails, then tests gd because imagick failed, fails again, and promotes gd to required for that run. The badge goes red and the heading stops saying recommended. Nothing about the site changed except the PHP version, and no new component broke. This is the same class of surprise as the update-check warning that appears after a server change: the underlying state moved, and a test that was always running simply started reporting it differently.

    The Two Modules Site Health Can Never Warn You About

    The sodium check carries an extra condition. Core records a failure only when the module is unavailable and the running PHP is older than the version that bundled it, which is 7.2. On any supported PHP version the second half of that condition is false, so no failure is ever recorded, whether or not sodium is loaded. And because mcrypt is examined only when libsodium has already failed, and libsodium can no longer fail, mcrypt is never examined either. Two entries sit in the list permanently unreachable. That is worth knowing before you go looking for them, because their absence from your warning is not evidence that they are present.

    What Each Missing Module Actually Costs You

    When recommended modules are missing the practical question is never which ones, it is what you lose while they are. Some of these cost fidelity that only an editor would notice. One of them quietly weakens upload validation. One blocks the mechanism every update arrives through. Sorting the list by consequence, rather than working down it alphabetically, is most of the work.

    The AHosting PHP Module Impact Ladder

    The last column is the one that decides whether this is yours to fix. A module that is pure PHP is a checkbox on your own account; a module that wraps a library installed at the operating-system level can only be offered if that library is on the server.

    Module, as Site Health names itWhat you enableWhat stops working without itFallbackNeeds a server-side library
    curlcurlOutbound requests fall to a slower transport; some plugins refuse to activateNoneYes, libcurl
    zipzipUnpacking plugin, theme and core update packageszlibYes, libzip 0.11 or newer
    imagickimagickHigh-fidelity resizing and PDF thumbnails in the media librarygdYes, ImageMagick 7.1 or newer
    intlintlLocale-correct dates, currency, number formatting and sortingNoneYes, ICU
    fileinfofileinfoDetecting an uploaded file type from its contentsNoneNo
    mbstringmbstringCorrect handling of accented and non-Latin textNoneNo
    exifexifReading orientation and capture data from photographsNoneNo
    mod_xmllibxmlFeed reading, imports and any plugin that parses XMLsimplexml, xmlreaderYes, libxml
    The AHosting PHP Module Impact Ladder. Module names are as WordPress prints them; the second column is the name the cPanel extension list uses.

    imagick Is the One With a Memory Bill

    WordPress ships two image editors and picks between them at runtime, preferring the Imagick editor when the extension is available. Enabling it is not free, and this is the part a host can tell you that a general guide cannot. The extension loads the ImageMagick library into the PHP worker, and ImageMagick keeps its own resource limits in a policy file separate from any PHP setting, including how much memory it will hold a decoded image in. Those limits sit inside your account container, not beside it. A WP Bronze plan publishes 2 GB of account memory and up to 30 concurrent PHP workers; a WP Gold plan publishes 4 GB and 50. Every worker that is resizing a large upload is spending from the same pool, which is the mechanism behind a PHP memory limit that appears not to work. The extension itself is a separate package rather than part of PHP, which is why it is a checkbox at all.

    intl Is the One a WooCommerce Store Should Care About

    Editors notice imagick. Shoppers notice intl. The extension carries the Unicode locale data that decides how a price, a date and a sorted list of names are rendered for a particular country, and without it those operations fall back to generic rules that read as correct English and as wrong almost everywhere else. A store selling in one country in one language will never see a symptom. A store selling across borders sees them on every invoice, and there is no fallback module standing in. If the extension is not offered on your account it is because the ICU library behind it is missing from the server, which is a different conversation from ticking a box. Anyone running a store should confirm it is loaded before the next peak trading period rather than during one.

    The Handbook the Warning Links To Disagrees With the Warning

    There is one genuine inconsistency worth knowing about, because it sends people looking for the wrong thing. The description core prints under the recommended modules are missing heading links to the WordPress Hosting Team handbook as the authoritative list of required and recommended modules. That handbook names the JSON extension and the mysqli extension as required. The Site Health test that printed the link marks the JSON extension and the hashing extension as required, and does not treat mysqli as required at all. The two documents therefore disagree about one entry each, in both directions. Neither is wrong for its own purpose: the handbook describes what a host should provide, while the test describes what core will check for and how it will grade the result. Read the handbook when you are choosing a plan. Read the test when you are reading the test.

    How to Fix Recommended Modules Are Missing on an AHosting cPanel Plan

    Every AHosting shared and WordPress plan publishes selectable PHP versions, and on a CloudLinux server the interface that selects the version is also the interface that carries the extension list for it. Each installed version keeps its own configuration directory and loads its own set of modules, which is both how you fix a recommended modules are missing warning and why it comes back after a version change.

    1. Open Site Health, expand the entry, and write down every module name it lists. This list is the whole input to the rest of the procedure.
    2. Translate the two names that need it: mod_xml means libxml, and libsodium means sodium.
    3. Open Select PHP Version in cPanel and confirm which version is currently active. If you are unsure whether to change it, choose the version first and the extensions second.
    4. Switch to the extensions list for that version and tick the modules you noted. Save.
    5. Return to Site Health and re-run it. The entry should clear, or name a shorter list.
    6. If a module you need is not in the list at all, stop. That is the server-library case, and nothing you do on this screen will change it.

    What to Do When the Module Is Not in the List

    An extension that wraps a system library cannot be offered unless the library is installed on the machine. imagick needs ImageMagick, intl needs ICU, zip needs libzip. When one of those is absent from the extension list rather than present and unticked, the fix is a support request naming the module, the PHP version and the site, and it is a reasonable request to make. Where this stops being reasonable is a module that is genuinely unusual, or a specific library version your application pins. At that point you have outgrown what a shared PHP build can be asked to carry, and a server with root access is the honest answer rather than a sales one, because installing an arbitrary extension is a root operation.

    Why Enabling Every Module Is the Wrong Instinct

    The extension list is long and the checkboxes are free, so the temptation is to tick everything and never read that recommended modules are missing again. Resist it for two reasons. Every loaded extension is memory in every PHP worker, and on a shared plan the workers are counted, so a bloated PHP build reduces how many requests the account can hold at once. And extensions occasionally conflict or change behavior in ways that surface as a fatal error on one plugin rather than as a warning anywhere useful. Tick what Site Health named, re-run the test, and stop. The same restraint applies to the rest of that screen, including the autoloaded options entry, where the reflex fix is also worse than the measured one.

    Decode the Module Named in Your Warning

    Pick the module Site Health named when it reported that recommended modules are missing. The decoder gives you what that module provides, what you lose without it, whether a fallback is quietly covering for it, and whether the fix is a checkbox or a ticket.

    Missing Module Impact Decoder

    Pick the module named in your warning, say what the site does, and it tells you what that module actually provides, what stops working without it, whether a fallback is covering for it, and whether this is a checkbox on your account or a library on the server.

    —

    What the module provides:

    What stops working without it:

    Is anything covering for it:

    Do this first:

    The decoder reads the module list the way core builds it: every entry is optional unless it is standing in for something that has already failed. It cannot see which extensions your PHP version actually loaded, so confirm against the extension list in cPanel before changing anything.

    A Practical Checklist for Clearing Recommended Modules Are Missing

    • Read the module names under the heading before touching any setting. The heading itself carries no information.
    • Note the badge color. Yellow means every missing module is optional. Red means a fallback has failed and core has promoted it.
    • Translate mod_xml to libxml and libsodium to sodium before searching the extension list.
    • Confirm which PHP version is active, because the extension list belongs to the version and not to the account.
    • Prioritize by consequence: curl and zip first, then fileinfo, then imagick and intl according to what the site actually does.
    • A module missing from the list entirely, rather than present and unticked, is a server library question and belongs in a ticket.
    • Re-run Site Health immediately after every PHP version change, and re-tick what the previous version had.

    Clearing a recommended modules are missing warning needs no support ticket on an AHosting account, and that is deliberate: our WordPress plans include selectable PHP versions, WP-CLI and a jailed shell precisely so the reader of a warning like this can act on it in the same session they read it. Where a module turns out to need a library the server does not carry, that part is ours, and naming the module in a ticket is enough to start it. The work above is the part you keep; the part underneath it is what the plan is for.

    Frequently Asked Questions About Missing WordPress PHP Modules

    What does the “The optional module, imagick, is not installed or has been disabled” warning mean in WordPress?

    Specifically it means WordPress looked for the imagick extension in the PHP your account is running, did not find it loaded, and recorded that as one line inside a larger Site Health test. The wording is generated by core from a list of modules it checks one at a time, so the sentence is identical whichever module is named and tells you nothing about severity on its own. What it does tell you is that imagick was absent at the moment the test ran, on the PHP version the site is using right now. A different PHP version on the same account can produce a different list, which is why the warning often appears immediately after a version change rather than after anything was uninstalled.

    Can a WordPress site run normally when recommended modules are missing in 2026?

    Typically yes, and that is the whole point of the word recommended. Core marks only two modules as required, and everything else in the test is optional, which means the site keeps serving pages, taking orders and running cron whether or not the named module is present. What changes is quality rather than availability: images are resized by a less capable library, dates and currency sort by byte order instead of locale rules, or an upload is accepted without its type being sniffed properly. The warning is a statement about the ceiling your PHP build puts on WordPress, not a statement that anything is broken.

    What should I do first when Site Health reports recommended modules are missing?

    First and foremost, read which module is named before you touch anything, because the list under the heading is the only part that carries information. Expand the Site Health entry, write down every module it lists, then check the PHP version the site is running, since those two facts together explain almost every instance of this warning. Only after that does it make sense to open the PHP settings in cPanel. Changing a PHP version to clear a warning you have not read is the most common way people turn a cosmetic notice into a site that throws fatal errors on a plugin that was never tested on the new version.

    imagick vs gd: which one matters more when recommended modules are missing?

    In practice gd matters more, because gd is what keeps working when imagick is absent. Core treats gd as the declared fallback for imagick, so a site with gd and no imagick still resizes every upload, still builds every thumbnail and still serves responsive image sets. The visible cost is fidelity on resizing and the loss of PDF thumbnails in the media library. The situation that actually hurts is the one nobody looks for: both absent at once, because the fallback rule changes what core does about it rather than simply adding a second line to the same warning.

    intl vs mbstring: which missing PHP module breaks more on a WooCommerce store?

    By contrast with imagick, both of these are felt by shoppers rather than by editors, and intl is the one that bites hardest on a store selling across borders. The intl extension carries the Unicode locale rules that decide how a price, a date and a sorted list of names are formatted for a given country, so without it those fall back to a generic representation that is correct English and wrong everywhere else. The mbstring extension matters wherever product names, addresses or reviews contain characters outside plain Latin text. A store trading in one country in English notices neither; a store trading in six notices both.

    Can I fix recommended modules are missing myself on AHosting shared hosting?

    Fortunately for most of the modules the answer is yes, and it takes about a minute. Every AHosting shared and WordPress plan includes selectable PHP versions, and the same cPanel screen that chooses the version carries the extension list for it, so enabling a module is a checkbox rather than a ticket. The exception is a module that depends on a library installed at the operating-system level rather than inside PHP: if that library is not on the server, the checkbox for it does not exist to be ticked. That case is the one worth a support ticket, and the guide above shows how to tell the two apart in the interface itself.

    Does AHosting enable imagick by default, and how do I check it in 2026?

    Accordingly the honest answer is that you should check rather than take anyone’s word for it, including ours, because the loaded extension list belongs to the PHP version the account is running and that is a per-account setting you control. Open Select PHP Version in cPanel and read the extension list for the version currently selected, which is the authoritative answer for your account at this moment. The command line gives the same answer faster if you prefer it, and every plan includes a jailed shell, so php -m printed from cPanel Terminal lists every module PHP has actually loaded.

    Why does the recommended modules are missing warning come back after a PHP version change?

    Indeed this is the single most common way the warning appears on a site that was clean yesterday, and the reason is that the extension list is a property of the version, not of the account. Each installed PHP version keeps its own configuration directory and loads its own set of modules, so switching from one to another swaps the whole list rather than carrying your selections across. A module you ticked two years ago on an older version is simply not ticked on the new one. Re-running Site Health straight after any version change, and re-ticking what the previous version had, turns this from a mystery into a two-minute step.

    Will clearing recommended modules are missing speed up an AHosting WordPress site in 2026?

    Ultimately no, and it is worth being blunt about that because the warning sits under a badge marked Performance and invites exactly this hope. Enabling imagick does not make pages render faster for visitors; it changes the quality of images produced when a file is uploaded, which is work that happens once per upload and never during a page view. The module most likely to affect what a visitor experiences is an object cache, and that is a separate Site Health entry with a separate recommendation. Treat this warning as a correctness and capability question, and look elsewhere for speed.

    Is libsodium missing from Site Health a problem I should be worried about?

    Interestingly you will almost certainly never see it named, because core skips the check entirely on any PHP version from 7.2 upward, where the extension ships with PHP itself. The test records a failure only when the module is unavailable and the running PHP predates the version that bundled it, so a modern site cannot produce that line whether or not the extension is actually loaded. The same silence covers mcrypt, which core only examines when libsodium has already failed. If you are running a supported PHP version, these two are outside what this test is able to report to you at all.

    September 14, 2026
  • WordPress Could Not Establish a Secure Connection to WordPress.org: How to Read the Error and Fix It on Shared Hosting

    WordPress Could Not Establish a Secure Connection to WordPress.org: How to Read the Error and Fix It on Shared Hosting

    • What "Could Not Establish a Secure Connection to WordPress.org" Actually Means
      • The Warning Is a Fallback Notice, Not a Failure
      • Why the Secure Connection to WordPress.org Warning Appears Intermittently
    • The Four Requests Behind the Secure Connection to WordPress.org, and Their Timeouts
      • Why Site Health Passes While the Secure Connection to WordPress.org Fails
    • The AHosting WordPress.org Connection Decoder
      • The Decoder Table
      • Trust Errors: When the Secure Connection to WordPress.org Cannot Be Verified
      • Connectivity Errors: When the Request Never Reaches WordPress.org
    • Why the Secure Connection to WordPress.org Fails on Shared Hosting Specifically
      • The Certificate Bundle Is Not Yours to Change
      • A Three-Second Clock Meets a Throttled Account
      • WP_HTTP_BLOCK_EXTERNAL Blocks It From Inside wp-config.php
    • How to Fix a Failed Secure Connection to WordPress.org, in Order
      • First Step: Find Out Whether Updates Are Broken At All
      • Second Step: Act on What the Error Line Names
      • Third Step: Confirm With a Real Update Check
    • Decode Your WordPress.org Connection Error
    • When the Secure Connection to WordPress.org Is Not the Problem
    • A Practical Checklist for a Failed Secure Connection to WordPress.org
    • Frequently Asked Questions About the Secure Connection to WordPress.org Error
      • Why does it keep saying an unexpected error occurred?
      • What does "WordPress could not establish a secure connection to WordPress.org" mean in 2026?
      • Is a failed secure connection to WordPress.org the same as a broken site?
      • Site Health vs the update check: why does only one report a secure connection to WordPress.org problem?
      • Can I fix a secure connection to WordPress.org error myself on AHosting shared hosting?
      • cURL error 60 vs cURL error 28: which secure connection to WordPress.org failure is a firewall?
      • Does a failed secure connection to WordPress.org stop security updates on a WooCommerce store in 2026?
      • What does WP_HTTP_BLOCK_EXTERNAL do to the secure connection to WordPress.org on AHosting?
      • How do I test the secure connection to WordPress.org from an AHosting cPanel account?
      • Should I download cacert.pem to fix this error in 2026?
    TL;DR

    The warning means one HTTPS request to api.wordpress.org failed, and core then retried the same request over plain HTTP. So the message alone does not say whether updates are broken. Read the error line: a certificate error is the trust store on your server, a timeout is the three-second clock the update checks run on, and a blocked-URL message is a constant in your own wp-config.php.

    The warning arrives at the top of wp-admin, usually while you are trying to do something else, and it reads like an outage: an unexpected error occurred, something may be wrong with WordPress.org or this server’s configuration. Core appends a second sentence that is far more useful, saying it could not establish a secure connection to WordPress.org and to contact your server administrator. Underneath sits one line naming what actually went wrong. This guide explains what the request was, why it runs on a clock most people never see, what each error line means on a cPanel account, and which half of the list you can fix yourself. A failed secure connection to WordPress.org is rarely what it looks like.

    Listen: WordPress prints the warning and then retries the same request unencrypted, which is why one message covers two opposite situations. By Matt Chrust, Director of Business Development, AHosting.

    What “Could Not Establish a Secure Connection to WordPress.org” Actually Means

    WordPress needs to ask an outside service one question repeatedly: is there anything newer than what this site is running. That question goes to api.wordpress.org over HTTPS, and the warning appears when the encrypted attempt comes back as an error rather than an answer. Nothing about your own site’s certificate is involved, and nothing about your visitors is involved either. The secure connection to WordPress.org is your server acting as a client, outbound, to somebody else’s server.

    The Warning Is a Fallback Notice, Not a Failure

    Here is the part almost every guide omits, and it changes what you should do next. When the HTTPS attempt returns an error, core prints this warning and then immediately repeats the identical request over plain HTTP to the same endpoint. The core version check shows the pattern plainly: the request is made, the warning is raised, and the unencrypted retry runs on the very next line. Two consequences follow. A site can carry this warning permanently while its updates work perfectly, because the fallback is succeeding and the check is simply running unencrypted. And a site can carry the same warning while nothing updates at all, because the fallback is failing too. The message does not distinguish them; the updates screen does.

    Why the Secure Connection to WordPress.org Warning Appears Intermittently

    Two mechanisms make the warning look random. The first is severity: core raises it as a user warning when output has already started or when debugging is switched on, and as a quieter notice otherwise, so whether it is drawn on screen depends on what the page was doing when the check ran. The second is throttling. Core waits a full minute between version checks and stores the result in a transient, so reloading the dashboard in frustration does not re-run anything. Neither mechanism means the fault is intermittent. The fault is constant, and its visibility is not.

    One failed HTTPS request, one warning, and a retry that decides what it means WordPress sends an HTTPS request to api.wordpress.org. If the request returns an error, core prints the warning that says it could not establish a secure connection to WordPress.org, and then immediately repeats the identical request over plain HTTP. If that retry succeeds, updates keep working and the warning is the only symptom. If the retry also fails, the update check returns nothing, the updates screen shows a fully patched site, and background updates stop running. One warning, two completely different situations Core prints the message, then retries the same request unencrypted. The retry decides what the warning means. 1. HTTPS request to api.wordpress.org 3 second clock on a page load 2. It returns an error The warning is printed here, with the error line under it 3. Retry over plain HTTP Same body, same endpoint, no encryption Retry succeeds Updates appear. Plugins install. The only symptom is the warning itself, and the check ran unencrypted. Retry also fails The update check returns nothing. The updates screen looks fully patched, and background updates stop firing. The dashboard prints the identical warning in both cases. Only the updates screen separates them. Check a plugin you know is outdated before you change anything on the server.

    The Four Requests Behind the Secure Connection to WordPress.org, and Their Timeouts

    WordPress does not make one call to WordPress.org. It makes four, each from a different function, each to a different endpoint, and each with its own time limit. Every one of them prints this same warning independently when its HTTPS attempt fails, which is why the message can appear several times on one page load. The limits are the interesting part, because they are short enough to matter on shared hosting and are published nowhere a site owner would look.

    What WordPress is checkingEndpoint at api.wordpress.orgTime limit on an admin page loadTime limit under cron
    Core version/core/version-check/1.7/3 seconds30 seconds
    Plugin updates/plugins/update-check/1.1/3 seconds, plus 1 second per 10 plugins30 seconds
    Theme updates/themes/update-check/1.1/3 seconds, plus 1 second per 10 themes30 seconds
    Core file checksums/core/checksums/1.0/3 seconds30 seconds
    Site Health communication testthe host root, by GET10 seconds10 seconds
    The WordPress.org request timeouts, read from core source on 2026-09-14 — four update checks on a three-second clock, and one Site Health test on a ten-second clock.

    Why Site Health Passes While the Secure Connection to WordPress.org Fails

    That last row explains the single most confusing version of this problem. Site Health runs a test called “Can communicate with WordPress.org” and gives its request ten seconds. Every update check gives its request three. A network path that completes in five seconds therefore passes Site Health and fails all four update checks, and the dashboard ends up asserting both that WordPress.org is reachable and that it could not be reached. Both are true. They were measured against different clocks, and the three-second one is the one your updates depend on.

    The AHosting WordPress.org Connection Decoder

    Find the line printed under the warning in the left column. Everything to the right of it is what that line means on a cPanel account running LiteSpeed and CloudLinux, and, in the last column, the thing generic advice never tells you: whether a failed secure connection to WordPress.org is yours to fix at all.

    The Decoder Table

    The line under the warningWhat failedUsual cause on a shared accountWho changes it
    cURL error 60: SSL certificate problemTrust: the certificate could not be verifiedStale certificate authority bundle, or curl.cainfo pointing at a hand-downloaded fileHost
    cURL error 35: SSL connect errorTrust: the handshake was refusedOld OpenSSL behind an old PHP versionYou, then host
    cURL error 77: error setting certificate verify locationsTrust: the bundle file is missingcurl.cainfo or openssl.cafile pointing at a path that no longer existsHost
    cURL error 6: Could not resolve hostConnectivity: DNSThe server resolver not answering, or filtering the nameHost
    cURL error 7: Failed to connectConnectivity: refusedAn outbound firewall rule on port 443Host
    cURL error 28: Operation timed outConnectivity: no answer in timeA silent drop, or an account too throttled to finish inside three secondsHost, or you
    User has blocked requests through HTTP to the URLNothing left the accountWP_HTTP_BLOCK_EXTERNAL set in wp-config.php with no allowlist entryYou
    A plugin name instead of a cURL codeA filter ran before the HTTP layerA security plugin filtering outbound requestsYou
    The warning appears and updates still workOnly the encrypted attempt failedThe plain-HTTP retry is succeeding, so checks run unencryptedHost, not urgently
    The AHosting WordPress.org Connection Decoder — every error line the warning can carry, read against a cPanel account behind LiteSpeed and CloudLinux, and against who holds the setting that fixes it.

    Trust Errors: When the Secure Connection to WordPress.org Cannot Be Verified

    Errors 60, 35 and 77 all mean the connection reached WordPress.org and the encryption could not be established or believed. Certificate verification works from a local store: as curl’s own documentation puts it, “In your local CA store you have a collection of certificates from trusted certificate authorities that TLS clients like curl use to verify servers,” and curl verifies by default. That store is a file on the server. OpenSSL documents where it looks: a default directory, a default file, and environment variables that override both. The contents ultimately trace back to a root program rather than to your host, since Mozilla’s CA Certificate Program governs the NSS root store that “is not only used in Mozilla products such as the Firefox browser, but is also used by other companies in a variety of products.” When that file is old, a certificate that is perfectly valid looks untrustworthy.

    Connectivity Errors: When the Request Never Reaches WordPress.org

    Errors 6, 7 and 28 are a different class entirely, and no amount of certificate work touches them. Error 6 means the server could not turn api.wordpress.org into an address, so nothing was ever dialed. With error 7 the address was reached and the connection was refused, which on a shared server is usually an outbound rule on port 443 rather than anything about WordPress. Error 28 means the request went out and the answer did not arrive in time, and the time in question is three seconds on an ordinary page load. That last one is the error most often misread as a WordPress problem when it is a resource problem, in the same family as a 508 Resource Limit Reached page, and the next section is about why.

    Why the Secure Connection to WordPress.org Fails on Shared Hosting Specifically

    Three of the causes above behave differently on a shared account than on a server you administer yourself, and one of them is not a server question at all. Knowing which you are looking at decides whether the next step is a setting or a ticket, and that is worth establishing before anything gets changed.

    The Certificate Bundle Is Not Yours to Change

    This is the sentence that is missing from every forum thread on the subject. The certificate bundle PHP uses for cURL is chosen by the curl.cainfo directive, and PHP’s manual classifies that directive as INI_SYSTEM, meaning it can be set only in the master configuration. It cannot be changed from a .user.ini file, and it cannot be changed by ini_set inside a plugin. On a shared account the customer therefore cannot fix a stale trust store, no matter how many bundles they download. Downloading one is worse than useless, and the Common CA Database says why: root store data is curated for specific products, and while the bundles “may seem convenient for re-use,” re-purposing them is precisely what the operators warn against. A frozen snapshot of who was trusted in 2023 is not a fix. Root access, which every VPS plan includes, is what makes this directive reachable at all.

    A Three-Second Clock Meets a Throttled Account

    Three seconds is generous on an idle server and tight on a busy shared one. An account that is hitting its I/O or CPU ceiling does not fail loudly; it simply does everything more slowly, including opening a socket and completing a handshake. The result is a timeout that looks like a network fault and is really a capacity reading, and the published ceilings on our shared plans are what that capacity is measured against. Our write-up of disk I/O throttling on shared hosting covers the symptom in general, because a three-second outbound request is far from the only thing it quietly breaks. Note the asymmetry the timeout table creates: the same check that fails on a page load usually succeeds when cron runs it, because cron gets thirty seconds instead of three.

    WP_HTTP_BLOCK_EXTERNAL Blocks It From Inside wp-config.php

    One cause has nothing to do with the server, and it is worth ruling out first because it costs a minute. WordPress ships a constant that refuses outbound HTTP entirely, and the method that enforces it is documented plainly: defining WP_HTTP_BLOCK_EXTERNAL as true “will only allow localhost and your site to make requests,” while WP_ACCESSIBLE_HOSTS takes a comma-separated allowlist in which “wildcard domains are supported.” A site hardened years ago by a developer who has since moved on carries this quietly, and the error text is distinctive: it names the blocked URL rather than printing a cURL code. Adding api.wordpress.org to the allowlist restores update checks without undoing the hardening.

    How to Fix a Failed Secure Connection to WordPress.org, in Order

    Work through these in sequence and stop when the warning clears. The order matters: the first step decides how urgent this is, the second acts on what the error line names, and the third confirms the thing you actually care about rather than the thing that complained.

    First Step: Find Out Whether Updates Are Broken At All

    Before changing anything, establish which of the two situations you are in. Go to Dashboard, then Updates, and press Check Again. If the screen finds updates, the plain-HTTP fallback is working and your site is not in danger today, though every check is running unencrypted until this is fixed. If the screen reports everything current on a site you know has an outdated plugin, the fallback is failing too and the site is accumulating unpatched code while telling you the opposite, which is the gap server-level protection is there to narrow. That second case is the urgent one, and it is the reason this warning matters on a store far more than on a brochure site.

    Second Step: Act on What the Error Line Names

    1. A blocked-URL message: open wp-config.php, then either remove WP_HTTP_BLOCK_EXTERNAL or add api.wordpress.org to WP_ACCESSIBLE_HOSTS. No server involvement at all.
    2. A plugin name in place of a cURL code: deactivate security and performance plugins one at a time, pressing Check Again after each, and stop when the warning goes.
    3. cURL error 35: switch the account to a current PHP version in cPanel and re-test, because the OpenSSL build follows the PHP version.
    4. cURL errors 60 and 77: open a ticket quoting the exact line and the PHP version. These are the system-level directives, and no customer-side change reaches them.
    5. cURL errors 6 and 7: confirm the name resolves from your own computer first, then open a ticket stating that it resolves for you and not from the server.
    6. cURL error 28: check the resource usage page in cPanel for faults around the time the warning appeared, and treat a clean page as evidence for the network path rather than the account.

    For the trust errors specifically, there is a quick way to show the trust store is the problem rather than WordPress. From the cPanel terminal, request a page from the badssl.com test endpoints and compare: a healthy store accepts the ordinary host and rejects the untrusted-root one. A store that rejects both is stale, and that result belongs in the ticket.

    Third Step: Confirm With a Real Update Check

    Re-running Site Health is not confirmation here, because its ten-second limit will pass paths the update checks still fail. Press Check Again on the Updates screen instead, and watch whether the plugin list repopulates. If WP-CLI is available in your jailed shell, wp core check-update makes the same request WordPress makes and prints the error in full rather than truncating it to a line. A site that finds updates again, from a page load rather than from cron, has genuinely recovered. Anything else is the fallback still carrying it.

    Decode Your WordPress.org Connection Error

    Pick the line printed under the warning, say whether your updates screen still finds updates, and pick roughly how many plugins the site runs. The decoder names what failed, what usually causes it here, who holds the setting, and where to start.

    WordPress.org Connection Decoder

    Pick the error line printed under the warning, say whether your updates screen still finds updates, and pick how many plugins the site runs. It tells you what failed, what most often causes it on a cPanel account, who is able to change it, and the first thing to do.

    —

    What actually failed:

    Most likely on a shared account:

    Who can change it:

    Do this first:

    The decoder reads the error the way core produces it: the HTTPS attempt failed, the warning was printed, and the same request was then retried unencrypted. It cannot see your server logs, so treat the cause as the first thing to rule out rather than a verdict.

    When the Secure Connection to WordPress.org Is Not the Problem

    Two situations look like this and are not. The first is a site where updates never appear and no warning is printed anywhere: that is usually a scheduler that has stopped running rather than a connection fault, and our guide to the failed loopback request covers the request WordPress makes to itself, which is a different journey with different failure modes. The second is a PHP installation missing the OpenSSL extension outright, in which case core never attempts HTTPS, never prints this warning, and quietly does every update check in the clear. A look at the PHP version and extensions in cPanel settles that one in a minute.

    The last column of the decoder is the honest part. Your side owns the blocking constant, the plugin filter and the PHP version, and those are the majority of real cases. The trust store, the resolver and the outbound firewall are ours, and a ticket quoting the exact error line is what our support works from, around the clock. What removes the whole question from your plate is on every plan we sell: a current managed trust store on the server, selectable PHP versions in cPanel, and on our WordPress plans a jailed shell with WP-CLI so you can run the real check yourself instead of reading a truncated notice. On a store, where an unflagged payment extension is the actual risk, that matters enough that the WooCommerce plans treat update visibility as part of the platform rather than as the site owner’s problem. The diagnosis above is what we would do on the ticket. The first two steps are what you can do tonight.

    A Practical Checklist for a Failed Secure Connection to WordPress.org

    • The full error line under the warning has been copied out, code and all, before anything was changed.
    • The Updates screen has been checked with Check Again, so you know whether the plain-HTTP fallback is carrying the site or failing with it.
    • wp-config.php has been searched for WP_HTTP_BLOCK_EXTERNAL, and api.wordpress.org added to WP_ACCESSIBLE_HOSTS if the constant is present.
    • Security and performance plugins have been ruled out, one at a time, if the error names a plugin rather than a cURL code.
    • The PHP version has been confirmed current in cPanel, since the OpenSSL build behind it follows the version.
    • No certificate bundle has been downloaded by hand, because curl.cainfo is INI_SYSTEM and cannot be pointed at it from a shared account.
    • For a trust error, the badssl.com endpoints have been requested from the terminal, and the result recorded for the ticket.
    • For a timeout, the resource usage page has been read for faults at the time the warning appeared.
    • Confirmation was taken from the Updates screen rather than from Site Health, whose ten-second limit passes paths the three-second checks fail.
    • A ticket carrying the exact line has been opened for anything in the host column, rather than a description of the symptom.

    Frequently Asked Questions About the Secure Connection to WordPress.org Error

    Why does it keep saying an unexpected error occurred?

    Typically it keeps appearing because the check behind it keeps running. WordPress asks api.wordpress.org four separate questions on a schedule, and each one prints this warning independently when its HTTPS attempt fails, so a single underlying fault produces the message again and again as the core, plugin, theme and checksum checks come round. The warning is also throttled rather than continuous: core waits a minute between version checks, which is why it can look intermittent on a busy dashboard. Nothing clears it except fixing the layer that is breaking the outbound request, because the message is printed fresh each time the request fails.

    What does “WordPress could not establish a secure connection to WordPress.org” mean in 2026?

    Specifically, it means the HTTPS request your server made to api.wordpress.org returned an error instead of a response. The sentence is appended by core to a more general warning, and it is the precise half: the failure happened while establishing the secure connection to WordPress.org, not while parsing the answer. What core does next is the part most guides omit. It immediately repeats the identical request over plain HTTP, so the warning on its own does not tell you whether updates are broken. It tells you that the encrypted attempt failed and that a fallback was tried.

    Is a failed secure connection to WordPress.org the same as a broken site?

    Notably it is not, and the distinction decides how urgent this is. Visitors reach your site over a path that has nothing to do with this request: they come inbound to your server, while the secure connection to WordPress.org is outbound from your server to somewhere else. A site with this warning serves pages normally, takes orders normally and keeps its own certificate. What it loses is the ability to learn that an update exists, which is a security problem that grows quietly rather than an outage anyone will phone you about.

    Site Health vs the update check: why does only one report a secure connection to WordPress.org problem?

    In practice they use different time limits, and that single difference explains the most confusing version of this problem. Site Health’s communication test allows ten seconds for its request. The update checks allow three seconds on an ordinary admin page load, plus one extra second for every ten plugins. So a path that completes in five seconds passes Site Health and fails every update check, and the dashboard ends up telling you both that WordPress.org is reachable and that it could not be reached. Both readings are accurate; they were measured against different clocks.

    Can I fix a secure connection to WordPress.org error myself on AHosting shared hosting?

    In particular, the answer turns on which error line you have, and for the most common one it is no. The certificate-authority bundle that verifies WordPress.org is chosen by the PHP directive curl.cainfo, which PHP classifies as INI_SYSTEM, meaning it cannot be changed from a .user.ini file or from ini_set inside a plugin. Only the host can move it. By contrast, a blocking constant in wp-config.php, a security plugin filtering outbound requests, and an overdue update queue are all yours to fix in minutes. The decoder in this guide splits the list on exactly that line.

    cURL error 60 vs cURL error 28: which secure connection to WordPress.org failure is a firewall?

    By contrast with what the numbers suggest, error 28 is the firewall candidate and error 60 is almost never one. Error 60 says the connection reached WordPress.org and the certificate could not be verified against the trust store on your server, which is a certificate-authority problem on your side of the wire. Error 28 says the request was sent and nothing came back before the clock ran out, which is what a firewall that drops packets silently produces, and also what a heavily throttled account produces when it cannot even open a socket in three seconds. So 60 points at trust and 28 points at the path.

    Does a failed secure connection to WordPress.org stop security updates on a WooCommerce store in 2026?

    Ultimately yes, and this is the reason the warning deserves attention on a store above anywhere else. WordPress does not poll each plugin author individually; it sends one request listing everything installed and receives one answer naming what has a newer version. When that exchange cannot complete, the updates screen shows nothing to update, which looks identical to being fully patched. A payment gateway or checkout extension with a published vulnerability therefore sits on the store unflagged, and automatic background updates that would normally close it never fire because they depend on the same answer.

    What does WP_HTTP_BLOCK_EXTERNAL do to the secure connection to WordPress.org on AHosting?

    Indeed this constant is the one cause that lives entirely inside your own installation, and it is worth checking early because it costs nothing to rule out. Defining it as true in wp-config.php tells the WordPress HTTP layer to refuse every outbound request except to localhost and to your own site, so the request never leaves the account at all. The companion constant WP_ACCESSIBLE_HOSTS takes a comma-separated allowlist and accepts wildcards, so adding api.wordpress.org restores the update checks while leaving everything else blocked. A hardening guide or a previous developer is the usual source, and the error text names the blocked URL rather than a cURL code.

    How do I test the secure connection to WordPress.org from an AHosting cPanel account?

    Fortunately you can reproduce the exact request rather than guessing, because every AHosting plan includes a jailed shell. Open Terminal in cPanel and run curl against api.wordpress.org, then read the exit status: a clean response means the trust store and the network path are both fine and the fault is inside WordPress. If WP-CLI is available, the wp core check-update command makes the same call WordPress makes and prints the error in full rather than truncating it. Running both takes under a minute and tells you whether to change a setting or open a ticket.

    Should I download cacert.pem to fix this error in 2026?

    As such this is the most common advice on the forums and the one most likely to cause a second problem. A certificate bundle downloaded by hand never updates itself, so it becomes a frozen snapshot of which authorities were trusted on the day you fetched it, and the Common CA Database warns directly that root store bundles are curated for particular products and are not meant to be re-purposed. On a shared account the directive that would point at your file cannot be set by you in any case. The durable fix is the server’s managed trust store being current, which is a ticket rather than a download.

    September 14, 2026
  • Your Site Could Not Complete a Loopback Request: How to Read the Error and Fix It on Shared Hosting

    Your Site Could Not Complete a Loopback Request: How to Read the Error and Fix It on Shared Hosting

    • What "Your Site Could Not Complete a Loopback Request" Actually Tests
      • The Loopback Request Is a POST to wp-cron.php With a Ten-Second Clock
      • Critical vs Recommended: Two Different Loopback Request Failures
    • What Stops Working When the Loopback Request Fails
    • The AHosting Loopback Error Decoder: What Each Code Means on Shared Hosting
      • The Decoder Table
      • Critical Loopback Request Failures: the cURL Codes
      • Recommended Loopback Request Failures: the Status Codes
    • Why a Loopback Request Fails on Shared Hosting Specifically
      • DNS During a Migration Sends the Loopback Request to the Old Host
      • Cloudflare Bot Fight Mode Challenges Your Own Server's Loopback Request
      • ModSecurity Rules and .htaccess Denies on wp-cron.php
      • The Entry-Process Ceiling: When the Loopback Request Gets a 508
    • How to Fix a Failed Loopback Request, in Order
      • First Step: Reproduce the Loopback Request From Outside the Server
      • Second Step: Fix the Layer the Loopback Request Code Names
      • Third Step: Re-run Site Health, Then Test Cron Directly
    • Decode Your Loopback Request Error
    • When the Loopback Request Is Not the Problem
    • A Practical Checklist for a Failed Loopback Request
    • Frequently Asked Questions About the Loopback Request Error
      • What does the "WordPress could not complete loopback request" error mean?
      • What does the Site Health loopback request test actually send in 2026?
      • Loopback request failed vs REST API error: are they the same problem in Site Health?
      • Why does the loopback request fail on AHosting shared hosting during a migration before DNS is switched?
      • Can Cloudflare Bot Fight Mode make the loopback request return a 403 on a WordPress site?
      • What does a 508 status on the loopback request mean on an AHosting Bronze plan?
      • cURL error 28 vs cURL error 7 on a loopback request: which one is a firewall?
      • Does a failed loopback request stop scheduled posts and WooCommerce emails in 2026?
      • How do I test whether loopback requests are working on AHosting without waiting for Site Health?
      • Should I disable WP-Cron to fix the loopback request warning in 2026?
    TL;DR

    A failed loopback request means WordPress could not reach its own wp-cron.php with a ten-second POST. The code printed under the label is the diagnosis: a cURL error means nothing answered (DNS, firewall, network), a status code means your own server refused (Cloudflare, ModSecurity, a deny rule, or the entry-process ceiling).

    The message sits under Critical issues in Site Health and reads like a network fault: your site could not complete a loopback request. Underneath it, WordPress prints one line that most guides skip past, and that line is the whole diagnosis: an error code from cURL, or an HTTP status code from your own server. This guide explains what the loopback request actually is, which features stop working when it fails, what each code means on a cPanel account behind LiteSpeed and CloudLinux, and how to fix the layer the code points at instead of switching plugins off one by one.

    Listen: why a critical result means nothing answered and a recommended one means your own server refused, and which layer to fix for each. By Matt Chrust, Director of Business Development, AHosting.

    What “Your Site Could Not Complete a Loopback Request” Actually Tests

    A loopback request is WordPress making an HTTP request to its own public address, the way a visitor would, and the Site Health test checks whether that round trip completes. Core describes the purpose in one sentence: “Loopback requests are used to run scheduled events, and are also used by the built-in editors for themes and plugins to verify code stability.” The test does not check your DNS, your firewall or your CDN by name. It sends one request and reports what came back, which is why the line under the label matters more than the label.

    The Loopback Request Is a POST to wp-cron.php With a Ten-Second Clock

    Specifically, the method behind the test posts a small body, site-health=loopback-test, to your site’s wp-cron.php, with a ten-second timeout, a Cache-Control: no-cache header, your current cookies, and any HTTP Basic credentials you used to reach wp-admin. Certificate checking is switched off for this request, so an expired or self-signed certificate cannot fail it. And wp-cron.php exits the moment it receives a POST: core checks for a non-empty POST body and calls die() before any scheduled event runs. The request therefore does the WordPress bootstrap and nothing else. A ten-second timeout means the server took ten seconds to start WordPress, or the request never arrived; it never means a cron job was slow.

    Critical vs Recommended: Two Different Loopback Request Failures

    Two outcomes are reported differently, and the difference is the first clue. If the HTTP client returns an error before any response arrives, the test is marked critical and prints “The loopback request to your site failed, this means features relying on them are not currently working as expected,” followed by the cURL message and its code. If a response arrives with any status other than 200, the test is only marked recommended and prints “The loopback request returned an unexpected http status code” with the number. In practice, a critical result means your server never replied, so look at DNS, the firewall or the network path; a recommended result means your server replied and refused, so look at whatever sits in front of PHP.

    One loopback request, six places it can fail, and the code each one prints The request starts inside WordPress on the server, resolves the site’s public domain name, passes through Cloudflare’s edge if the domain is proxied, arrives at the server firewall, is inspected by ModSecurity and any .htaccess rules, is admitted or refused by the CloudLinux entry-process limit, and finally reaches wp-cron.php, which answers 200 with an empty body. A failure at DNS prints cURL error 6, at the edge prints 403, at the firewall prints cURL error 7 or 28, at the rule layer prints 403 or 405, at the entry-process gate prints 508, and a slow bootstrap prints cURL error 28. One loopback request, six places it can fail WordPress posts to its own wp-cron.php. Each hop that refuses prints a different code in Site Health. 1. DNS lookup Where does my domain point? Fails as: cURL error 6 2. Cloudflare edge Only if the domain is proxied Fails as: 403 (challenge) 3. Server firewall Is the server’s own IP allowed? Fails as: cURL error 7 or 28 4. ModSecurity, .htaccess Does a rule match the POST? Fails as: 403 or 405 5. Entry-process gate Is there a free PHP slot? Fails as: 508 6. wp-cron.php Boots WordPress, sees a POST, exits Passes as: 200. Slow boot: cURL 28 A cURL code means no answer came back. A status code means your own server answered and refused. Critical is hops 1 and 3, or a ten-second boot. Recommended is hops 2, 4 and 5.

    What Stops Working When the Loopback Request Fails

    The features that depend on the loopback request are mostly invisible until they stop, which is why the warning deserves more attention than its wording suggests. WP-Cron starts by making exactly this kind of request to wp-cron.php during a visitor’s page load, so a site that relies on it loses its scheduler:

    • Scheduled posts stay in the queue and show a missed schedule instead of publishing.
    • Plugin and theme update checks, and any automatic updates that depend on them, stall until something else runs the schedule.
    • WooCommerce’s Action Scheduler stops draining, and with it order emails, subscription renewals and webhook deliveries; on a store this is the first symptom anyone notices, which is why the migration checklist on our WooCommerce plans reviews cron jobs before DNS changes.
    • The built-in theme and plugin file editor cannot verify that a saved PHP change did not fatally break the site, so it refuses to keep the change.
    • Site Health’s own page-cache test cannot run; core prints “Unable to detect page cache due to possible loopback request problem” in its place.

    The REST API test that usually fails alongside it is a separate request, a GET to a route under wp-json, and it shares most of the same causes. Fixing the shared layer first, then re-running Site Health, shows which kind of failure you have.

    The AHosting Loopback Error Decoder: What Each Code Means on Shared Hosting

    Read the line under the label and find it in the table. Its left column is what Site Health prints; the rest is what that code means when the site runs on a cPanel account behind LiteSpeed and CloudLinux, which is what the generic advice never says.

    The Decoder Table

    Site Health printsWhat answeredUsual cause on a shared accountWho changes it
    cURL error 6Nothing: name lookup failedDNS not pointed yet (migration), expired domain, missing recordYou, at DNS
    cURL error 7Nothing: connection refusedFirewall refusing the server its own address; domain pointing elsewhereHost / you
    cURL error 28Nothing inside ten secondsSilent firewall or NAT drop; bootstrap slower than ten seconds under throttlingHost / you
    cURL error 35Nothing: TLS handshake failedTLS negotiation with the server’s own client, not certificate validityHost
    cURL error 52 or 56A connection that died mid-replyPHP killed by a memory or process ceiling; connection reset in the pathYou / host
    status 401Your server, asking for a passwordcPanel Directory Privacy covering wp-cron.phpYou
    status 403Your server, or the edge, refusingModSecurity rule, .htaccess deny, security plugin, Cloudflare Bot Fight ModeYou / host
    status 404A document root without the filewp-cron.php deleted; domain resolving to another siteYou
    status 405Your server, rejecting POSTA rule allowing only GET on wp-cron.phpYou / host
    status 429A rate limitPlugin or edge rule counting the server as a clientYou
    status 500 or 503PHP, or the web server on its behalfFatal error at bootstrap; memory or process limit; resource ceilingYou
    status 508CloudLinux: Resource Limit ReachedEvery entry process occupied at that instant by uncached requestsYou
    completed successfullywp-cron.php, with 200Not a loopback problem: missed jobs are a cron trigger problemYou
    The AHosting Loopback Error Decoder — the line Site Health prints, read against a cPanel account behind LiteSpeed and CloudLinux.

    Critical Loopback Request Failures: the cURL Codes

    A cURL code means the HTTP client gave up before a response arrived, and the libcurl error list defines each one precisely. Error 6, “Could not resolve host,” means the server could not turn your domain name into an address at all; on shared hosting that is almost always a domain whose DNS has not been pointed yet, or a domain that has expired. Next comes error 7, “Failed to connect() to host or proxy,” which means the connection was refused: a firewall rejecting the server’s own public address, or a domain resolving to a machine that is not this one. The common one is error 28, “Operation timeout,” meaning the request went out and nothing came back inside ten seconds. cPanel’s own support article on this exact WordPress message says “An incorrect NAT, firewall, or other security configuration can cause it,” and that is the usual shape: a firewall that drops rather than rejects. The other cause is a WordPress bootstrap slower than ten seconds, which happens on an account that is being throttled, and the cPanel article is worth reading because it names the firewall half plainly. Error 35 is a TLS handshake the server’s own client could not complete, unrelated to certificate validity since verification is off; errors 52 and 56 mean the connection opened and then produced nothing usable, which on a shared account most often means the PHP process serving the loopback was killed by a memory or process ceiling mid-request.

    Recommended Loopback Request Failures: the Status Codes

    A status code means something answered, and the number tells you what. The 401 is HTTP authentication: cPanel’s Directory Privacy on a staging copy covers wp-cron.php along with everything else, and while Site Health forwards the credentials you logged in with, a scheduled check has none. Next, 403 is a refusal, and it has four common sources on this stack: a ModSecurity rule that matched the POST, a deny rule on the file in .htaccess, a security plugin that treats the server’s own address as an attacker, and a Cloudflare challenge if the domain is proxied. With a 404, the document root that answered has no wp-cron.php, either because it was deleted as a hardening step or because the domain resolves to a different site. On a 405, POST is not allowed on that path, which is a rule permitting only GET. The 429 is a rate limit counting the server as a client. Then 500 or 503 is PHP failing at bootstrap or the web server refusing to run it, and on this platform a 503 can also be a resource ceiling. Finally, 508 is CloudLinux itself, and it gets its own section below.

    Why a Loopback Request Fails on Shared Hosting Specifically

    Four of the causes in the decoder are far more common on a shared account than on a server you administer yourself, because each one is a layer you do not control or a layer you share. Knowing which of the four you are looking at decides whether the fix is a setting of yours or a ticket.

    DNS During a Migration Sends the Loopback Request to the Old Host

    The loopback request goes to your public domain name, not to the server it runs on. While your DNS still points at the previous host, WordPress on the new account resolves that name to the old address and sends the request there, and whatever the old host returns becomes your Site Health result: a 404, a 403, a 200 from the wrong site, or a timeout. Nothing is wrong with the new account. This is the single most common way the warning appears the day a site moves, and our guide to moving a WordPress site without downtime puts the Site Health check after the DNS switch for this reason. On a shared account there is no per-site hosts file to force the name to resolve locally before the switch; that control is one of the things a VPS with root access gives you, and it matters most to agencies that migrate sites every week.

    Cloudflare Bot Fight Mode Challenges Your Own Server’s Loopback Request

    When the domain is proxied through Cloudflare, the loopback request leaves your server, resolves your domain to Cloudflare’s edge, and arrives there as automated traffic carrying a WordPress user agent. That is precisely what Bot Fight Mode exists to challenge, and Cloudflare’s documentation is direct about the consequences: the feature protects entire domains “without endpoint restrictions,” it “may challenge API or mobile app traffic,” and “You cannot bypass or skip Bot Fight Mode using WAF custom rules or Page Rules.” The same page gives the way out: Super Bot Fight Mode “runs on the Ruleset Engine and supports Skip rules,” so a skip for wp-cron.php becomes possible there, or the feature is turned off. Our write-up of running LiteSpeed Cache behind Cloudflare covers the rest of what the proxy changes on this stack.

    ModSecurity Rules and .htaccess Denies on wp-cron.php

    A web application firewall in front of PHP inspects the loopback POST like any other request, and a rule can match it. The OWASP Core Rule Set documentation calls this a false positive, “When a genuine transaction causes a rule from CRS to match in error,” and notes that false positives “need to be tuned away by writing rule exclusions.” Its worked example is a WordPress request. If your cPanel shows a ModSecurity item under Security, it lists every hit with its rule ID and lets you switch the engine off per domain to confirm the diagnosis; if it does not, the rule log is readable only on our side, and a ticket with the timestamp is how it gets read. Either way the durable fix is an exclusion for that rule ID, which is a ticket. Separately, a hardening guide from years ago may have left a deny rule on wp-cron.php in .htaccess, or a rule that allows only GET, and those produce the 403 and 405 rows respectively. Search the file for the filename before looking anywhere else.

    The Entry-Process Ceiling: When the Loopback Request Gets a 508

    The loopback request is one more PHP request from your own account, made at the instant the test runs. CloudLinux caps the number of those that can run at once, and its own knowledge base states what happens at the cap: “Once the number of entry processes (Apache/HTTP requests is reached), a user will get a 508 “Resource Limit Reached” error message.” So a 508 in Site Health means every slot was occupied when the test fired. Two facts about our platform make that easier to read. A page served from LiteSpeed’s cache consumes no entry process at all, so the slots are filled only by uncached requests: wp-admin, logged-in views, carts, checkouts, AJAX and bots. And the ceilings are published per plan on our shared hosting plans, so the arithmetic can be stated rather than guessed:

    PlanEntry processesSlots one Site Health loopback test holdsUncached requests in flight before the test sees a 508
    BronzeUp to 302 (the test request and its loopback)28
    SilverUp to 40238
    GoldUp to 50248
    Entry-process slots and the loopback request, per AHosting shared plan — ceilings from the published plan page; the test holds one slot for the request running the check and one for the loopback it makes. Cached pages hold none.

    A 508 during the test is therefore a load reading, not a network fault, and our guide to the 508 Resource Limit Reached error explains how to find what was uncached at that moment. The same ceiling is why WP-Cron itself competes with visitors for a slot; the measured case for a server cron shows what that costs and how to move the schedule off the loopback path entirely.

    How to Fix a Failed Loopback Request, in Order

    Work in this order and stop when Site Health passes. The first step costs a minute and usually names the layer; the second is the fix for that layer; the third confirms the features that depend on the loopback request are actually working again.

    First Step: Reproduce the Loopback Request From Outside the Server

    The test is an ordinary HTTP request, so you can make the same one from your own computer and compare. From a terminal, run curl -s -o /dev/null -w "%{http_code} %{time_total}\n" -X POST -d "site-health=loopback-test" https://yourdomain.com/wp-cron.php. Beside it, run dig yourdomain.com, the DNS lookup utility documented in the ISC BIND manual pages, so you know which address the request would have reached. A 200 in well under a second from outside, beside a failure inside Site Health, means the path works for visitors and is broken only from the server itself, which points at DNS resolution on the server or at a rule that treats the server’s own address differently. Getting a 403 from outside as well means the block is in front of everyone, and seeing a slow result from outside as well means the account is slow to boot WordPress, which is a throttling question.

    Second Step: Fix the Layer the Loopback Request Code Names

    1. DNS (error 6, or the wrong site answering): confirm the domain resolves to this server from your own computer. If it does not, the record is the fix; if you are mid-migration, wait for propagation and test again.
    2. Cloudflare (403 with the proxy on): open Security, then Analytics, and look for the request labeled Bot Fight Mode at the time of the test. Turn it off, or move to Super Bot Fight Mode and add a skip rule for wp-cron.php.
    3. ModSecurity (403 with nothing else to explain it): if cPanel shows a ModSecurity item under Security, note the rule ID of the hit, switch the engine off for the domain, re-run the test, then switch it back on and ask for an exclusion for that rule ID; if it does not, open a ticket with the timestamp and the rule log gets read on our side.
    4. Rules of your own (403, 405): search .htaccess for wp-cron.php and remove any deny or method restriction; check security plugins for a block on your server’s own IP or on unauthenticated requests to the file.
    5. Directory Privacy (401): remove the protection or exclude wp-cron.php from it.
    6. Firewall (error 7 or 28 from Site Health, 200 from outside): open a ticket with the exact line. This is a server-side path and only the host can see it.
    7. Entry processes (508): open the resource usage page, find the entry-process faults at the time of the test, and reduce what is uncached before retrying.

    Third Step: Re-run Site Health, Then Test Cron Directly

    Go to Tools, then Site Health, and re-run the Status tab; the loopback test runs asynchronously, so give it a moment. Then test the feature that matters rather than the test that flagged it: if WP-CLI is available in your cPanel terminal, wp cron test performs the spawn check WordPress itself uses, and wp cron event list shows whether events are still overdue. If the loopback request now passes and events still miss, the schedule trigger is the problem and a server cron is the answer. If the test still times out from inside the server after the firewall has been ruled out, the bootstrap itself is slow, and disk I/O throttling is the cause that produces exactly that symptom without printing an error anywhere.

    Decode Your Loopback Request Error

    Pick the line Site Health printed, say whether the domain is proxied through Cloudflare, and pick your plan. The decoder tells you which layer answered, what most often causes it on this stack, who can change it, and the first thing to do.

    Loopback Error Decoder

    Pick the line Site Health printed under the label, say whether your domain is proxied through Cloudflare, and pick your plan. It tells you which layer answered, what most often causes it on a cPanel account behind LiteSpeed and CloudLinux, who can change it, and the first thing to do.

    —

    Which layer answered:

    Most likely on a shared account:

    Who can change it:

    Do this first:

    The decoder reads the code the way the Site Health test produces it: a cURL code means no HTTP response arrived inside ten seconds; a status code means a response arrived and was not 200. It cannot see your logs, so treat the cause as the first thing to rule out, not a verdict.

    When the Loopback Request Is Not the Problem

    Two situations look like this warning and are not. The first is a loopback request that passes while scheduled jobs still miss: that is WP-Cron’s page-load trigger on a quiet or fully cached site, or a DISABLE_WP_CRON constant with no server cron behind it, and the fix is a cron job in cPanel that runs WP-CLI on a fixed interval. The second is a REST API failure with the loopback passing, which is almost always a security plugin or a rule that blocks unauthenticated access to wp-json, not a network path.

    That column in the decoder, “who changes it,” is honest about where the line falls. DNS records, Cloudflare settings, .htaccess, plugins and Directory Privacy are yours; the server firewall, a ModSecurity exclusion and the TLS layer are ours, and a ticket carrying the exact line from Site Health is what our support works from, around the clock. What takes the loopback request out of the picture for good is on every plan we sell: cron jobs in cPanel, so the schedule runs from the server rather than from a page load, and on our managed WordPress plans a jailed shell with WP-CLI to run it and to test it in one line. The reading above is what we would do on the ticket; the server cron is what you can set up tonight, and the reason the warning stops mattering even before it is cleared.

    A Practical Checklist for a Failed Loopback Request

    • The line under the label has been read and written down, code and all, before anything was changed.
    • The same POST to wp-cron.php has been made from outside the server, and its status code and time were compared with Site Health’s result.
    • The domain has been confirmed to resolve to this server from your own computer, and if a migration is in progress, the test has been deferred until after the DNS switch.
    • If the domain is proxied through Cloudflare, Security Analytics has been checked for a Bot Fight Mode challenge on the request.
    • cPanel has been checked for a ModSecurity item under Security, and any hit at the time of the test has had its rule ID noted for an exclusion.
    • .htaccess has been searched for wp-cron.php, and any deny or method restriction removed.
    • Directory Privacy is not covering the WordPress directory, or wp-cron.php has been excluded from it.
    • For a 508, the resource usage page has been checked for entry-process faults at the time of the test, and the uncached traffic filling the slots has been identified.
    • For a critical result that passes from outside, a ticket has been opened with the exact line, because the remaining causes are server-side.
    • Scheduled jobs have been moved to a server cron running WP-CLI, so they no longer depend on the loopback request at all.

    Frequently Asked Questions About the Loopback Request Error

    What does the “WordPress could not complete loopback request” error mean?

    Specifically, it means WordPress tried to make an HTTP request to its own public address, the way a visitor would, and that request either never got an answer or got an answer other than 200. The test behind the message posts a tiny body to your site’s wp-cron.php and gives it ten seconds. Because wp-cron.php exits the moment it sees a POST, the request only exercises DNS, the network path, whatever sits in front of PHP, and the WordPress bootstrap itself. The line printed underneath the label carries the actual diagnosis: a cURL error code when nothing came back, or an HTTP status code when your own server refused.

    What does the Site Health loopback request test actually send in 2026?

    In practice it sends one POST request to your site’s wp-cron.php with the body site-health=loopback-test, a Cache-Control no-cache header, your current cookies, any HTTP Basic credentials you used to reach wp-admin, and a ten-second timeout. Certificate verification is switched off for this request, so an expired or self-signed certificate cannot fail it. That is the whole test: no DNS lookup of its own, no firewall probe, no cron job. If the request returns 200 the test passes, if it returns any other status the test is marked recommended, and if the HTTP client errors before a response arrives the test is marked critical.

    Loopback request failed vs REST API error: are they the same problem in Site Health?

    Typically they share a cause but they are two different requests. The loopback test posts to wp-cron.php; the REST API test fetches a route under wp-json with the current user’s cookies and nonce. Both leave the server, resolve your domain, come back in through whatever sits in front of PHP, and boot WordPress. So a firewall, a DNS mismatch or a Cloudflare challenge usually fails both at once, while a security plugin that blocks unauthenticated REST access or a rule that only denies wp-cron.php fails exactly one. Fixing the shared layer first, then re-running Site Health, tells you which kind you have.

    Why does the loopback request fail on AHosting shared hosting during a migration before DNS is switched?

    Notably, the loopback request uses your public domain, not the server it is running on. While your domain’s DNS still points at the old host, WordPress on our server resolves that name to the old host’s address and sends the request there. Depending on what the old host does with it, Site Health reports a 404, a 403, a 200 from the wrong site, or a timeout. Nothing is broken on the new account; the test is simply being answered by the wrong server. Once the DNS change has propagated the same test passes without any change on our side, which is why we recommend running Site Health only after the switch.

    Can Cloudflare Bot Fight Mode make the loopback request return a 403 on a WordPress site?

    Indeed it can, and it is one of the most common causes on a domain proxied through Cloudflare. The loopback request leaves your server, resolves your domain to Cloudflare’s edge, and arrives there as automated traffic from a WordPress user agent, which Bot Fight Mode is designed to challenge. Cloudflare’s own documentation says the feature protects the whole domain without endpoint restrictions, may challenge API traffic, and cannot be bypassed with WAF custom rules or page rules. The practical fixes are to turn Bot Fight Mode off, or to move to Super Bot Fight Mode, which runs on the ruleset engine and does honor skip rules for wp-cron.php.

    What does a 508 status on the loopback request mean on an AHosting Bronze plan?

    In fact a 508 on the loopback request is your own entry-process ceiling talking. A Bronze account allows up to 30 concurrent PHP requests, and the loopback is one more PHP request from the same account, made at the instant the test runs. When every slot is already occupied, CloudLinux refuses the new request with 508 Resource Limit Reached, and Site Health reports it as a recommended issue with that number. Because a page served from LiteSpeed’s cache consumes no entry process at all, a 508 during the test means uncached requests were filling the account at that moment, and the fix is to find them rather than to retry the test.

    cURL error 28 vs cURL error 7 on a loopback request: which one is a firewall?

    By contrast with what the numbers suggest, either can be a firewall, and the difference is how the firewall behaves. Error 7 means the connection was refused outright: something answered the connection attempt with a rejection, or nothing was listening at the address the domain resolved to. Error 28 means the request was sent and then waited the full ten seconds with no answer, which is what a firewall that silently drops packets produces, and also what a server that takes longer than ten seconds to start WordPress produces. So a 7 points at the address or an active refusal, while a 28 points at a silent drop or a slow bootstrap, and the test from outside the server tells you which.

    Does a failed loopback request stop scheduled posts and WooCommerce emails in 2026?

    Ultimately yes, when the site relies on WP-Cron, because WP-Cron itself is started by a loopback request to wp-cron.php on a visitor’s page load. If that request cannot complete, scheduled posts stay in the queue and show a missed schedule, plugin update checks stall, and WooCommerce’s Action Scheduler queue, which carries order emails, subscription renewals and webhook deliveries, stops draining. The Site Health warning is therefore an early signal of a problem you would otherwise discover from a customer. A server cron that calls WP-CLI directly does not depend on the loopback request and keeps those jobs running even while the test fails.

    How do I test whether loopback requests are working on AHosting without waiting for Site Health?

    Fortunately the test is easy to reproduce from any computer, because the loopback request is an ordinary HTTP request. Run curl against your own domain with the same shape Site Health uses: a POST to wp-cron.php with the body site-health=loopback-test, and look at the status code. A 200 with an empty body from outside the server, alongside a failure inside Site Health, means the path is fine for visitors and broken only from the server itself, which points at DNS resolution on the server or at a rule that treats the server’s own address differently. If WP-CLI is available in your cPanel terminal, wp cron test performs the spawn check WordPress itself uses and reports the result in one line.

    Should I disable WP-Cron to fix the loopback request warning in 2026?

    That said, disabling WP-Cron does not clear the warning, because the test still posts to wp-cron.php whether or not the constant is set, and the file still answers. What disabling WP-Cron does is remove your scheduled jobs from the loopback path, so a server cron that runs WP-CLI keeps them going while you fix the underlying block. That is a sensible first move on a store or any site with time-critical jobs, and it is the right permanent setup on shared hosting regardless. The warning itself is fixed at the layer the error code names: DNS, the firewall, a Cloudflare setting, a ModSecurity rule, a deny rule on the file, or the account’s entry-process ceiling.

    September 11, 2026
  • Autoloaded Options Could Affect Performance: How to Read the Site Health Warning and Clear It on Shared Hosting

    Autoloaded Options Could Affect Performance: How to Read the Site Health Warning and Clear It on Shared Hosting

    • What "Autoloaded Options Could Affect Performance" Actually Measures
    • Why the Autoloaded Options Warning Appeared on a Site Nobody Touched
      • The 800 KB Threshold Is New, but the Data Is Not
      • Large Options Stop Being Autoloaded at 150 KB, but Only Going Forward
      • Transients Without an Expiry Are Autoloaded Options Too
    • What Autoloaded Options Cost on Shared Hosting
      • Cached Pages Pay Nothing, Uncached Requests Pay Every Time
      • Every Concurrent Request Holds Its Own Copy: the AHosting Autoload Headroom Ladder
      • Why the Admin Feels the Autoloaded Options Cost Before Visitors Do
    • How to Measure Your Autoloaded Options in Three Places
      • Site Health: the Total and the Count
      • phpMyAdmin: the Query That Matches What WordPress Loads
      • WP-CLI, If Your Shell Has It
    • How to Reduce Autoloaded Options Safely, in Order of Payoff
      • Row 1: Export Before Anything Else
      • Row 4: Switch Autoloaded Options Off per Row, Never Wholesale
      • Row 5: Measure Which Autoloaded Options Are Actually Read
    • Estimate What Your Autoloaded Options Hold at Full Concurrency
    • When Reducing Autoloaded Options Is Not the Fix
    • A Practical Checklist for Clearing the Autoloaded Options Warning
    • Frequently Asked Questions About Autoloaded Options on Shared Hosting
      • How do I clean up autoloaded options in WordPress in 2026 without breaking the site?
      • What does the Site Health warning "Autoloaded options could affect performance" actually measure?
      • Autoloaded options vs transients: which one is filling the wp_options table?
      • Page cache vs object cache: which one stops autoloaded options from costing anything on AHosting?
      • Why is wp-admin slow while visitors say the site is fast on AHosting shared hosting in 2026?
      • Why are some autoloaded options larger than 150 KB still loading after the WordPress 6.6 change?
      • How many autoloaded options can a WordPress site hold on an AHosting Bronze plan before memory becomes the problem?
      • Is 800 KB of autoloaded options still the right threshold in 2026 for a WooCommerce store?
      • Will setting all autoloaded options to autoload off make WordPress faster on shared hosting?
      • Should I raise the PHP memory limit to fix the autoloaded options warning in 2026?
    TL;DR

    The warning that autoloaded options could affect performance means WordPress now loads more than 800 KB of settings before it routes every uncached request. Cached pages never pay it; your admin, your checkout and every logged-in view pay it in full. Export the options table, clear expired transients, delete leftovers from removed plugins, then switch autoload off per large row — never wholesale.

    The message is short, it is marked critical, and it appeared on a site you did not change: autoloaded options could affect performance. Site Health prints a row count and a size beside it, neither of which means much on its own, and the advice you find next tends to be a plugin recommendation. This guide explains what the check measures, why it started firing on sites that had been fine for years, and what the cost actually is on a shared hosting account, where most of your visitors never pay it and you pay it on every click. Then it walks the cleanup in the order that clears the most with the least risk.

    Listen: why the warning appeared on sites nobody changed, why visitors never pay the cost while the admin always does, and the order to clean it up in. By Matt Chrust, Director of Business Development, AHosting.

    What “Autoloaded Options Could Affect Performance” Actually Measures

    The warning measures one number: the combined size of every option WordPress loads before it knows which page it is serving. Settings live in the wp_options table, and each row carries an autoload flag. Rows flagged on are fetched together in a single query on every request that reaches PHP, unserialized into memory, and held for the life of that request so that core, the theme and every plugin can read their settings without a query each. That single load is what the check weighs.

    Specifically, the Site Health test for autoloaded options sums the byte length of those rows and raises a critical issue at 800,000 bytes. The message is worth reading precisely, because it carries two numbers: “Your site has 1,068 autoloaded options (size: 1 MB) in the options table, which could cause your site to be slow.” The count tells you how many rows are loaded before routing; the size tells you how much data they carry. Size is the one that hurts, since a single 600 KB row costs more to fetch and unserialize than three hundred rows of a few bytes.

    The warning is a measurement, not a diagnosis. It cannot tell you whether the set is made of settings a live plugin reads on every page or the debris of plugins you removed in 2021, and it says nothing about whether any visitor ever feels the cost. Both of those depend on where the request came from, which is the part this guide is about.

    Two request paths: the one that loads every autoloaded option, and the one that never starts PHP A request arriving at the server takes one of two paths. On the cached path, LiteSpeed serves the page from LSCache, PHP never starts, no options are loaded and no entry process is consumed. On the uncached path, taken by admin pages, logged-in views, carts, checkouts, AJAX and cron, PHP boots, WordPress queries every autoloaded option in one load, unserializes the whole set into memory, and only then works out which URL it is serving. The autoloaded options cost is paid on the second path only, which is why visitors rarely see it and the site owner always does. One request, two paths — and only one of them loads your options Where the autoloaded options cost is paid, and where it is never paid at all CACHED PATH public pages LSCache built earlier 1. LiteSpeed finds the page in cache 2. Serves it. PHP never starts. Options loaded: none Entry processes used: zero UNCACHED PATH wp-admin, logged-in views, cart, checkout, AJAX, cron 1. PHP boots WordPress 2. Loads EVERY autoloaded option, unserializes it 3. Only then routes the URL Options loaded: the whole set, every time Site Health draws its line at 800 KB. The people who cross it most often are the ones logged in. Visitors ride the cached path. You, your editors and every shopper at checkout ride the other one.

    Why the Autoloaded Options Warning Appeared on a Site Nobody Touched

    Three things changed in WordPress 6.6, released in July 2024, and together they explain why a site that had been quiet for years suddenly reported a critical issue. None of them made your options larger. One of them made you look.

    The 800 KB Threshold Is New, but the Data Is Not

    The check itself is what arrived in 6.6. Before that release, nothing in WordPress measured the autoloaded set, so a site could carry 4 MB of leftover settings for years and never hear about it. Upgrading did not create the problem; it installed the instrument. That is why the warning reads as though something broke, when what actually happened is that a total which had been growing since the site was built was printed for the first time.

    Large Options Stop Being Autoloaded at 150 KB, but Only Going Forward

    The same release changed how new options are stored. The Options API dev note for 6.6 describes a size threshold, defaulting to 150,000 bytes, above which an option written without an explicit autoload instruction is no longer loaded on every request. It also replaced the old yes-or-no flag with five values — on, off, auto, auto-on and auto-off — and the loader now treats yes, on, auto-on and auto as loaded. Two consequences follow. A plugin that explicitly asks for autoload still gets it at any size, and rows written before 6.6 keep whatever flag they had. So any row over 150 KB that is still in your set is either older than the change or deliberately forced on, and either way it is the first thing to look at.

    Transients Without an Expiry Are Autoloaded Options Too

    A transient is a cached value stored as an ordinary option row, and its expiry decides its autoload flag: set with no expiry it is written as autoloaded, set with one it is not. Plugins use the no-expiry form for things they expect to refresh themselves, and when the plugin goes, the rows stay. The scheduled-events list is stored the same way, as one autoloaded option that grows with every recurring task a plugin registers, which is one reason a site with a busy cron schedule tends to carry a larger set than its plugin count suggests.

    What Autoloaded Options Cost on Shared Hosting

    The generic answer is “memory and speed,” and it is half right in a way that sends people to the wrong fix. On a CloudLinux shared account the cost has a specific shape, because the account has a fixed number of concurrent PHP requests and a fixed pool of memory they all share, and because most requests never reach PHP at all.

    Cached Pages Pay Nothing, Uncached Requests Pay Every Time

    A page LiteSpeed serves from LSCache never starts PHP, so no options are loaded, nothing is unserialized, and on our platform that request consumes zero entry processes. The autoloaded set costs exactly nothing on that path, however large it is. Every request that reaches PHP pays the full price: the admin, every logged-in page view, a cart, a checkout, every AJAX call, search, scheduled tasks, and the first hit on any page before the cache holds it. Our guide to splitting TTFB into cached and uncached shows how to measure that difference on your own site, and it is the first thing to do before blaming the database.

    An object cache does not change which path pays. WordPress checks the persistent cache for the whole autoloaded set before it queries the database, so a cache such as Redis or Memcached removes the query, but the set is still unserialized into PHP memory on every request that reaches PHP. That makes a bloated set cheaper, not free.

    Every Concurrent Request Holds Its Own Copy: the AHosting Autoload Headroom Ladder

    Each request that reaches PHP holds its own copy of the set for as long as it runs, and the account’s physical memory ceiling is shared by all of them. Our plan pages publish both halves of that arithmetic, the entry-process ceiling and the account memory, so the cost can be stated rather than described:

    PlanEntry processesAccount memoryPer-request budget at full concurrencySet held at 800 KB, all requests at onceSet held at 3 MB, all requests at once
    Bronze302 GB68 MB24 MB (1.2%)90 MB (4.4%)
    Silver403 GB77 MB32 MB (1.0%)120 MB (3.9%)
    Gold504 GB82 MB40 MB (1.0%)150 MB (3.7%)
    The AHosting Autoload Headroom Ladder — entry processes and account memory from the published shared and WordPress plan pages; the remaining columns are arithmetic on those two figures. Occupancy is a floor: unserialized arrays are larger than their bytes.

    Two things are visible in that table that the generic warning hides. The first is that memory is rarely the ceiling: even a set well past the line occupies a few percent of the account at full concurrency. The second is the per-request budget. When every entry process is busy, each request on Bronze has about 68 MB of the account to itself, and the set is subtracted from that before a single plugin has run. A request that needs more than its share reduces how many can run at once, so memory can become the first limit before the entry-process ceiling is ever reached. If you are already watching that ceiling, our write-up of the 508 resource limit error explains what it looks like from the other side.

    Why the Admin Feels the Autoloaded Options Cost Before Visitors Do

    A logged-in admin session is uncacheable, so every click in the dashboard runs the full boot, including the load. Visitors are served pages the cache built earlier and never see it. This is why a bloated set produces the specific complaint of an admin that feels slow while the public site tests fast, and why the same set on a store shows up at the cart and the checkout, which cannot be cached either. Stores compound it, because a busy admin also generates a steady stream of Heartbeat and admin-ajax requests, each of which is a full uncached boot. That is the reason our WooCommerce plans are sized on the uncached path rather than on catalog traffic, and it is the reason this cleanup pays off more on a store than on a blog with the same numbers.

    How to Measure Your Autoloaded Options in Three Places

    Three readings settle what you have, and each answers a different question. Site Health gives you the total, the database gives you the rows, and the command line gives you a number you can put in a monitoring script.

    Site Health: the Total and the Count

    Go to Tools, then Site Health, and read the Status tab. The autoloaded options item sits under Critical issues when the set is over the line and under Passed tests when it is not, and in both cases it prints the row count and the size. Write both down before you change anything, because the difference after each step is how you know which step mattered.

    phpMyAdmin: the Query That Matches What WordPress Loads

    Open phpMyAdmin from the Databases section of cPanel, as cPanel’s phpMyAdmin documentation describes, select the site’s database, and open the SQL tab. Most guides still filter on autoload = 'yes', which under-counts on any site running 6.6 or later, because rows written since then carry the new values. The query below matches the same four values the loader itself uses:

    SELECT COUNT(*), ROUND(SUM(LENGTH(option_value))/1024) AS kb FROM wp_options WHERE autoload IN ('yes','on','auto-on','auto');

    Then list the rows by size, using the same filter with ORDER BY LENGTH(option_value) DESC LIMIT 25 in place of the sum. The names usually identify the owner: a prefix matching a plugin you still run, a prefix matching one you removed, or _transient_ and _site_transient_ for cached values. If your table prefix is not wp_, substitute it in both queries. Our knowledge base article on cleaning up the WordPress database covers the rest of the table, including revisions and spam.

    WP-CLI, If Your Shell Has It

    Where WP-CLI is available, one command prints the total in bytes: wp option list --autoload=on --format=total_bytes, as the wp option list reference documents, and adding --fields=option_name,size_bytes lists the rows with their sizes. Put the first form in a weekly cron job and you have a trend line, which is worth more than any single reading: a set that grows 50 KB a week has an active writer, and finding it matters more than the cleanup.

    How to Reduce Autoloaded Options Safely, in Order of Payoff

    Work down this list and re-read Site Health after each row. The order is deliberate: every step is cheaper and safer than the one below it, and on the accounts we see the first three clear most cases. Nothing here needs a plugin, though one is named where it genuinely helps.

    OrderChangeWhat it does to the setReversible?
    1Export the options table as SQL from phpMyAdmin before touching anythingNothing yet; this is the undo button for every row belowIt is the undo
    2Clear expired transients (WooCommerce: Status, then Tools, then Clear expired transients)Removes cached values whose time has passedThey regenerate
    3Delete rows whose prefix belongs to a plugin you have uninstalledRemoves the debris that is usually most of the totalFrom the export
    4Set autoload off, per row, on large rows a live plugin does not need on every requestKeeps the data, stops loading itSet it on again
    5Measure which loaded options are actually used, then switch the unused ones offTrims what the prefix method cannot classifySet it on again
    6Find the plugin writing a row that keeps growing, and fix or replace itStops the set coming backDepends on the plugin
    Autoloaded options reduction in order of payoff — cheapest and safest changes first.

    Row 1: Export Before Anything Else

    Row 1 is not ceremony. phpMyAdmin’s export documentation puts it plainly: an SQL export can be used to restore your database, which is exactly what you want available before the first delete. Export the one table, not the whole database, and keep the file until the site has run a week.

    Row 4: Switch Autoloaded Options Off per Row, Never Wholesale

    Row 4 is where the real savings usually are, and it is also where people go wrong by doing it wholesale. Switching every row off makes things worse twice over: hundreds of small options that were read from one load now cost a query each, and the loader has a fallback that loads every option in the table when the autoload query returns nothing. Turn rows off one at a time, with wp option set-autoload option_name off or an UPDATE on that single option_name, starting with the largest.

    Row 5: Measure Which Autoloaded Options Are Actually Read

    Row 5 answers the question the prefix method cannot: whether a row from a plugin you still run is actually read on your pages. Joost de Valk built AAA Option Optimizer for exactly this, and his account of why option clutter matters is the clearest short explanation of the problem: those options are “still loaded into the memory on every pageview.” The plugin records which autoloaded options were used during real page loads over a few days, then lets you switch off or delete the ones that never were.

    Estimate What Your Autoloaded Options Hold at Full Concurrency

    Put in the size Site Health reported and pick your plan. If you also know the peak memory a request uses on your site, which Query Monitor shows in its overview, add that and the tool tells you whether memory or the entry-process ceiling is the limit you would reach first at peak.

    Autoload Headroom Check

    Take the size from the Site Health message, or from the query in the section above, and pick your plan. It tells you how far past the 800 KB line you are, what the set occupies across every concurrent request at once, and how much of the per-request budget it takes before a single plugin has run.

    —

    The occupancy figure is a floor: an unserialized PHP array is larger than the bytes it came from, and every request also carries its own object-cache copy of the set. The per-request budget is the account’s memory divided by its entry-process ceiling, which is what each request has when all of them are running at once.

    When Reducing Autoloaded Options Is Not the Fix

    Sometimes the set is already lean and the admin is still slow, and sometimes the set is large because a plugin you depend on genuinely needs it that way. Both are real, and both call for something other than another pass through the options table.

    If Site Health passes and the dashboard still drags, the database is not your problem. Compare the same URL cached and uncached first, then look at the other account ceilings, because a slow admin with a small option set usually turns out to be a CPU, memory or throughput limit being reached, and disk I/O throttling in particular produces exactly this symptom without ever printing an error. Raising the PHP memory limit is not the answer either; our memory limit guide explains why a per-script limit cannot create memory the account does not have.

    If the set is large for a reason, the honest fix is headroom rather than deletion. A plugin that keeps a big autoloaded structure because it reads it on every request is doing its job, and the cost it imposes is paid by concurrency. The cleanup above is the part you own; the ceilings it runs against are the part we publish, and the tier that fits is the one whose per-request budget your own reading lands inside. For a content site that is usually the next step on managed WordPress hosting, where the whole ladder moves together; for a general PHP application the same ceilings are listed on our shared web hosting plans; and where a single account carries many sites, each with its own set, VPS hosting gives every site the whole pool rather than a share of one.

    A Practical Checklist for Clearing the Autoloaded Options Warning

    • Site Health has been read and both numbers, the row count and the size, were written down before any change.
    • One URL has been timed cached and uncached, so the cost is known to be on the uncached path rather than assumed.
    • An SQL export of the options table exists, taken from phpMyAdmin, and the file is somewhere you will find it.
    • Your size query used the four loader values, not autoload = 'yes' alone, so it matches what WordPress loads on a 6.6-or-later site.
    • Each of the 25 largest rows has an owner named: a live plugin, a removed plugin, or a transient.
    • Expired transients have been cleared, from the WooCommerce tools where the store runs or from a cleanup tool where it does not.
    • Rows belonging to uninstalled plugins have been deleted, and rows whose owner cannot be named have been switched off rather than deleted.
    • Any row over 150 KB that is still autoloaded has been switched off per row, never with a table-wide update.
    • Site Health has been re-read after each step, so the step that mattered is known.
    • If the set is under the line and the admin is still slow, the diagnosis has moved on to the account ceilings rather than back to the database.

    Frequently Asked Questions About Autoloaded Options on Shared Hosting

    How do I clean up autoloaded options in WordPress in 2026 without breaking the site?

    First and foremost, export the options table before you touch it, then work in a fixed order: clear expired transients, delete the rows left behind by plugins you have already uninstalled, and only then turn autoload off for large rows that belong to plugins you still use. Every step except the last is reversible from the export, and the last one is reversible by turning autoload back on. The rule that keeps you safe is simple: never delete an option whose owner you cannot name. If a row's prefix does not match a plugin you recognize, set its autoload off rather than deleting it, and check what the site does over the following day.

    What does the Site Health warning "Autoloaded options could affect performance" actually measure?

    Specifically, it adds up the byte length of every row in the options table that WordPress loads on every request, and raises a critical issue when that total reaches 800,000 bytes. The check arrived in WordPress 6.6 and prints both the row count and the size, so a message reading 1,068 autoloaded options at 1 MB is telling you two things: how many rows are loaded before the page is routed, and how much data they carry. The number of rows matters less than the size, because one 600 KB row costs more to fetch and unserialize than three hundred rows of a few bytes each.

    Autoloaded options vs transients: which one is filling the wp_options table?

    In practice the two overlap, which is what makes the question confusing. A transient is stored as an ordinary option row, and a transient set with no expiry is written with autoload switched on, so it becomes part of the autoloaded set. A transient with an expiry is written with autoload off, so it fills the table without being loaded on every request. That distinction decides what each one costs you: expired transients with an expiry waste disk and slow the table down, while transients without one are loaded into memory on every uncached request until something deletes them.

    Page cache vs object cache: which one stops autoloaded options from costing anything on AHosting?

    Notably, only the page cache does. A page that LiteSpeed serves from LSCache never starts PHP, so no options are loaded and nothing is unserialized; on AHosting that request also consumes zero entry processes. A persistent object cache is different. It removes the database query, because WordPress checks the cache for the whole autoloaded set before it queries, but the set is still unserialized into PHP memory on every request that reaches PHP. So an object cache makes a bloated set cheaper per request, while a page cache makes it free on the requests it serves and leaves the admin, the checkout and every logged-in view paying the full price.

    Why is wp-admin slow while visitors say the site is fast on AHosting shared hosting in 2026?

    Typically because the two audiences are served by different paths. Visitors get pages LSCache built earlier, which skip PHP entirely, while a logged-in admin session is uncacheable and runs the full WordPress boot on every click, including loading and unserializing every autoloaded option. A large autoloaded set is therefore invisible to visitors and paid in full by the person who would notice it least kindly. The same split explains why a WooCommerce cart or checkout, which cannot be cached either, feels slower than the product pages around it.

    Why are some autoloaded options larger than 150 KB still loading after the WordPress 6.6 change?

    In fact the 6.6 rule only governs options written without an explicit autoload instruction. When a plugin saves a value that way and it exceeds roughly 150 KB, WordPress now records it as not autoloaded, but a plugin that explicitly asks for autoload still gets it at any size, and rows written before 6.6 keep whatever flag they already had. So a large row that is still loading on every request is one of two things: a legacy row from before the change, or a row a plugin deliberately marked to load every time. Both are fixed the same way, by setting that row's autoload off if nothing needs it on every request.

    How many autoloaded options can a WordPress site hold on an AHosting Bronze plan before memory becomes the problem?

    Interestingly, memory is almost never the ceiling the warning is about. On a Bronze plan the account holds 2 GB and allows 30 concurrent PHP requests, so even at the 800 KB threshold the autoloaded set occupies about 24 MB across all of them at once, and a 3 MB set occupies about 90 MB, a few percent of the account. What the warning is really about is the work each uncached request does before it can route the URL, and how much longer that request holds an entry process while it does it. The figure to watch is the per-request budget: at full concurrency each request on Bronze has about 68 MB of the account's memory, and a bloated set eats into that before any plugin runs.

    Is 800 KB of autoloaded options still the right threshold in 2026 for a WooCommerce store?

    Ultimately the 800 KB figure is WordPress's own line, unchanged since it was introduced in version 6.6, and it is a sensible warning level rather than a hard limit. Our support team's rule of thumb from the accounts we see is that a set under 1 MB is fine and one over 3 MB is worth an hour of your time. A store deserves more attention than a brochure site, not because the threshold changes but because more of its requests are uncached: cart, checkout, account pages and every AJAX call pay the full cost. A store sitting at 2 MB with a busy checkout is paying more for the same set than a blog sitting at 2 MB whose visitors are all served from cache.

    Will setting all autoloaded options to autoload off make WordPress faster on shared hosting?

    By contrast with the cleanup this guide recommends, switching every row off makes things worse in two ways. WordPress loads the set in one query precisely so that the hundreds of options core and your plugins read on every request do not each become their own query, so a site with nothing autoloaded runs hundreds of small queries where it used to run one. Worse, the loader has a fallback: if the autoload query returns no rows at all, it loads every option in the table instead, which is the largest possible set. Turn autoload off per row, for rows that are large and not needed on every request, and leave the small ones alone.

    Should I raise the PHP memory limit to fix the autoloaded options warning in 2026?

    That said, raising the limit changes nothing about the warning and very little about the cost. The check measures the size of the set, not the memory PHP is allowed, and the work of fetching and unserializing the rows is the same at any memory limit. Our plans allow a PHP memory limit of up to 512 MB, and the account also has a separate physical memory ceiling that every concurrent request shares, so a higher per-script limit does not create memory that is not there. Reduce the set instead; the limit only decides how large a single request may grow before it fails.

    September 10, 2026
1 2 3 … 6
Next Page→
Ahosting Logo

Hosting

  • WordPress Hosting
  • Web Hosting
  • FFmpeg Hosting
  • WooCommerce Hosting
  • Reseller Hosting
  • VPS Hosting
  • Dedicated Server

Domain

  • Register a Domain
  • Domain Transfer
  • Premium SSL Certificate

Support

  • Knowledge Base
  • Abuse Report
  • Submit A Ticket

Company

  • Compare Hosts
  • About Us
  • Datacenter
  • Contact Us
  • Blog
  • Sitemap

Legal

  • Privacy Policy
  • Terms of Service
  • Acceptable Use Policy
  • Service Level Agreement
  • Resource Abuse Policy
  • Hosting
    • WordPress Hosting
    • Web Hosting
    • FFMpeg Hosting
    • WooCommerce Hosting
    • Reseller Hosting
    • VPS Hosting
    • Dedicated Server
  • Domain
    • Register a Domain
    • Domain Transfer
    • Premium SSL Certificate
  • Support
    • Knowledge Base
    • Abuse Report
    • Submit A Ticket
  • Company
    • About Us
    • Datacenter
    • Contact Us
    • Blog
    • Sitemap
  • Legal
    • Privacy Policy
    • Terms of Service
    • Acceptable Use Policy
    • Service Level Agreement
    • Resource Abuse Policy

Copyright © 2026 All Rights Reserved

Ahosting, Inc. BBB Accredited Business, A+ rating
Facebook X/Twitter Instagram LinkedIn YouTube