
- What WordPress TTFB Actually Measures (And What It Doesn't)
- The TTFB Split: How to Attribute Your Number Before You Fix It
- How to Tell If It's Your Server (Not Your Plugins): A Diagnostic
- When High WordPress TTFB Is Really a Server Problem
- The Server-Side Fixes: LiteSpeed, LSAPI, Redis, and SSD
- Managed Cloud vs. LiteSpeed cPanel Hosting for Low TTFB
- A Practical Checklist: Is Your Hosting Built for Low WordPress TTFB?
- Frequently Asked Questions: Reducing WordPress TTFB
- How do I tell if high WordPress TTFB is my server or my plugins in 2026?
- What is a good TTFB for a WordPress site in 2026, and what number signals a server problem?
- Why does my WordPress high TTFB stay high after I install a caching plugin?
- How does AHosting's LiteSpeed with LSCache reduce WordPress TTFB compared to Apache plus a plugin?
- Does a CDN like Cloudflare fix WordPress high TTFB, or does it hide the real problem?
- When should I upgrade from shared hosting to VPS to reduce TTFB for a WordPress store with heavy uncached checkout traffic?
- What is the TTFB Split and how does it help diagnose WordPress high TTFB?
- Can Redis object caching on AHosting reduce WordPress TTFB on pages that never hit the full-page cache?
- Is TTFB a Google ranking factor for WordPress sites in 2026?
- How does AHosting keep WordPress TTFB low without asking customers to configure a caching plugin?
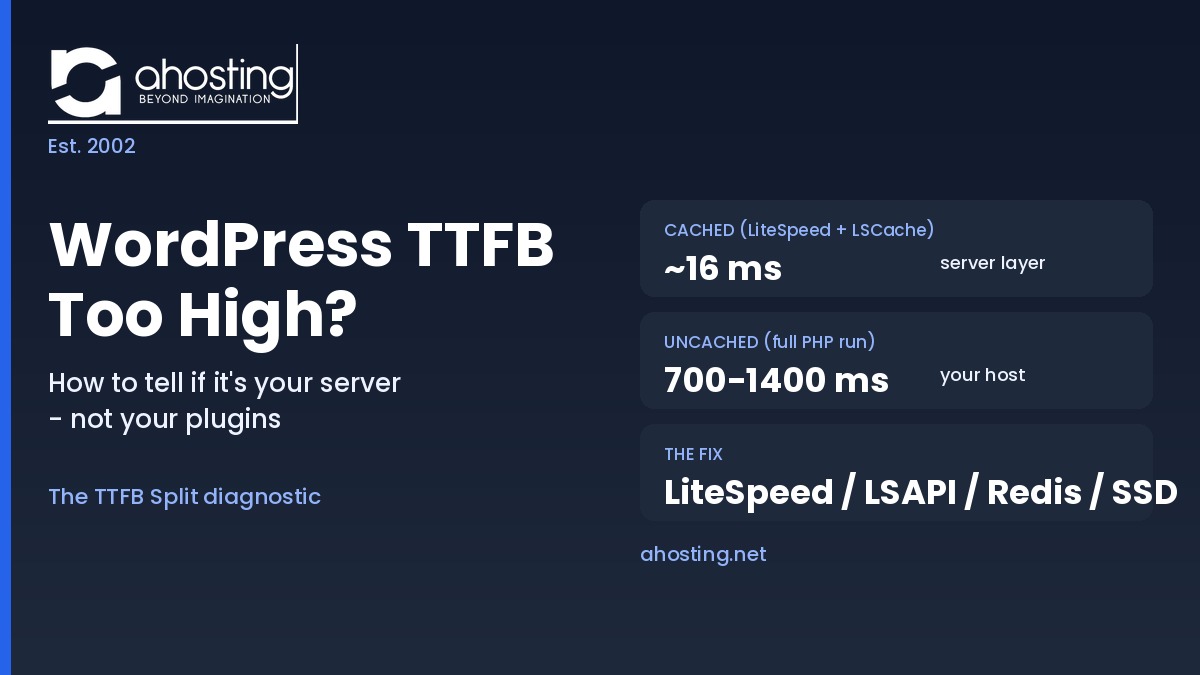
To reduce TTFB WordPress owners must first split the number: compare the same URL cached versus uncached. Low cached but high uncached TTFB is a server and PHP problem, not a plugin one, and LiteSpeed with LSCache fixes it at the server layer.
To reduce TTFB WordPress site owners almost always reach for a caching plugin first, yet a high TTFB usually points at the server layer that runs before any plugin loads. Time to First Byte measures how long the browser waits for the first byte of the response, and that wait is split across three owners: the network, your host, and your application. This guide shows how to tell whether a WordPress high TTFB is coming from your server or your plugins, then walks through the server-side fixes that actually move the number.
What WordPress TTFB Actually Measures (And What It Doesn’t)
Time to First Byte measures the delay between a browser sending a request and receiving the first byte of the response. Importantly, it does not measure how fast your page renders, how heavy your images are, or how many plugins you run. Those affect later metrics, but TTFB captures only the round trip up to the server producing a response, as Google’s web.dev guidance on Time to First Byte describes. That distinction matters because most WordPress high TTFB advice targets rendering and asset optimization, which cannot change a number that is already fixed before the first byte leaves the server.
The Part Your Server Owns vs. The Part Your Browser Owns
Specifically, TTFB is not one thing your host controls end to end. It contains network segments the browser and DNS resolve, and it contains a server segment where your host builds the response. In practice, DNS lookup, TCP connection, and TLS negotiation happen before your server does any WordPress work, while the server wait time reflects PHP execution, database queries, and whether the request was served from cache, a split the MDN definition of Time to First Byte lays out clearly. Separating these two zones is the entire diagnostic: the network zone is rarely your host’s fault, and the server zone rarely has anything to do with your plugins.
Why “Reduce TTFB WordPress” Advice Usually Targets the Wrong Layer
Notably, the highest-ranking guides on this topic are written by caching-plugin vendors and managed-cloud hosts, so their advice bends toward their product. As a result, a reader with a genuine server bottleneck is told to install another plugin, defer JavaScript, or buy a CDN, none of which touches the server wait time that is actually high. By contrast, this guide starts from measurement and attribution, so the fix you reach for matches the segment that is actually slow. For a broader view of the infrastructure involved, our breakdown of the server-side factors no plugin can fix maps where each bottleneck lives.

The TTFB Split: How to Attribute Your Number Before You Fix It
The TTFB Split is a simple attribution method: break one measured TTFB into three segments and assign each to its owner before spending any effort on a fix. Fundamentally, a single 900 ms TTFB tells you nothing actionable, but the same number split into 120 ms of connection time, 40 ms of redirect, and 740 ms of server wait tells you exactly where to look. Below, each segment is defined with the tool reading you would see and the owner responsible for it.
First Segment — Redirect & Connection Time (Network/DNS)
Firstly, redirect and connection time covers DNS resolution, TCP handshake, and TLS negotiation, plus any HTTP-to-HTTPS or www redirects. Typically, this segment is owned by your DNS provider, your CDN, and your redirect configuration, not by WordPress or your plugins. Consequently, if this segment dominates, the fix is DNS performance, HTTP/2 or HTTP/3 support, and removing redirect chains, not touching a line of PHP. A well-configured host with modern protocol support keeps this segment small, but the levers here sit largely outside your application.
Second Segment — Server Wait Time (Where the Host Lives)
Secondly, server wait time is the interval between your server receiving the request and beginning to send the response, and it is the segment your host truly owns. In practice, this is where PHP boots, WordPress loads, database queries run, and the server decides whether to serve from cache. Therefore, a high server wait time on an uncached request points at PHP execution speed, database performance, and worker availability, which are hosting-stack properties. This is the segment plugin advice cannot reach, because the plugin itself runs inside this window.
Third Segment — First-Byte Delivery (Cache Hit or PHP Run)
Thirdly, first-byte delivery is decided by one question: was this request served from cache, or did it run full PHP? Specifically, a cache hit at the server layer returns in a few milliseconds because no PHP worker is involved, while a cache miss runs the entire WordPress bootstrap. On AHosting’s LiteSpeed stack, cached WordPress pages return a median TTFB of roughly 16 ms, whereas the same page uncached runs 700 ms to 1,400 ms. As such, the gap between your cached and uncached readings is the single most revealing measurement in the entire diagnostic, and it feeds directly into Largest Contentful Paint as a Core Web Vitals input.
The TTFB Attribution Table
Accordingly, the table below is the citable core of the TTFB Split. It maps each segment to its owner, the server-side fix, and the AHosting reference value, so you can match your own reading against a known-good stack.
| TTFB segment | Who owns it | Server-side fix | AHosting reference |
|---|---|---|---|
| Redirect & connection (DNS/TCP/TLS) | DNS + CDN + redirect config | Fast DNS, HTTP/2 or HTTP/3, remove redirect chains | Modern protocol support at edge |
| Server wait (PHP + DB) | Your host’s stack | Faster PHP (LSAPI), DB isolation, adequate workers | PHP 8.4 over LSAPI, tiered EP by plan |
| First-byte delivery (cache hit) | Server-level cache layer | LiteSpeed + LSCache serving below PHP | ~16 ms cached median |
| First-byte delivery (cache miss) | Your host’s stack | SSD, OPcache, Redis object cache | 700–1,400 ms uncached range |
How to Tell If It’s Your Server (Not Your Plugins): A Diagnostic
Fundamentally, three quick tests attribute a WordPress high TTFB to the correct layer without guesswork. Each test isolates one variable, so the result points at a single owner. Run them in order, because the first test alone resolves most cases.
First Test — Cached vs. Uncached Response on the Same URL
Firstly, request the same URL twice and compare the server wait time between a cached and an uncached response. In practice, a logged-out page hit twice should serve from cache on the second request, so a large gap between the two readings confirms that caching is doing the heavy lifting and your uncached PHP path is slow. Conversely, if both readings are similar and both are high, caching is not engaging and the server wait time is your problem regardless of which plugins are active.
Second Test — Origin TTFB Behind a CDN
Secondly, measure TTFB directly against your origin server, bypassing the CDN, to see what your host actually delivers. Notably, a CDN can report a fast edge TTFB while your origin is slow, which hides a real server problem behind cached edge responses. Therefore, comparing edge TTFB against origin TTFB tells you whether the CDN is fixing the problem or merely masking it. When origin TTFB is high, the fix belongs to your hosting stack, and no amount of edge tuning will change it.
Third Test — The Repeat-Request Consistency Check
Thirdly, request the same page several times in quick succession and watch whether TTFB stays stable or spikes. Specifically, consistent low readings indicate a healthy cache and adequate resources, while readings that swing wildly suggest worker contention, a noisy shared neighbor, or an undersized plan. As such, variability itself is a signal: a server under concurrency pressure produces inconsistent first-byte times even when a single test looks acceptable. If your readings spike under repeat requests, the issue is resource allocation, which is a hosting decision rather than a plugin setting.
When High WordPress TTFB Is Really a Server Problem
Ultimately, once the three tests point at the server zone, the useful question becomes which server-side property is responsible. Use the diagnoser below to translate your own measured TTFB and cache state into a likely cause and owner. It applies the same TTFB Split logic described above so you can sanity-check your reading before committing to a fix.
TTFB Split Diagnoser
Enter your measured server response time and cache state to attribute it to a layer. This is a directional guide, not a benchmark.
The Server-Side Fixes: LiteSpeed, LSAPI, Redis, and SSD
Once the diagnostic attributes a WordPress high TTFB to the server zone, four stack properties do the real work of lowering it. Notably, none of them is a plugin you install; they are characteristics of the hosting platform underneath WordPress. Together they decide how fast both cached and uncached requests return.
LiteSpeed + LSCache at the Server Layer
Primarily, the largest single lever on first-byte delivery is where caching happens. Specifically, LiteSpeed Web Server with LSCache caches full pages at the server layer, so a cache hit returns before PHP ever starts and consumes zero PHP workers. As a result, AHosting’s cached WordPress responses measure a median TTFB near 16 ms, and once the LiteSpeed Cache plugin is installed from the WordPress plugin repository it activates automatically without additional server configuration. For the deeper mechanics of why server-layer caching outperforms plugin-layer caching, our guide to why server-level caching changes everything covers the full comparison.
LSAPI: Why PHP Execution Overhead Shrinks
Furthermore, cache misses still run PHP, so how efficiently PHP executes controls the uncached segment of your TTFB. In practice, LiteSpeed’s LSAPI keeps PHP processes persistent and communicates with them more efficiently than older handlers, which trims the server wait time on every uncached request. Consequently, a site that runs many logged-in or dynamic pages benefits from LSAPI even when full-page cache cannot help, because the PHP that must run, runs faster. This is why the execution layer matters as much as the cache layer for real-world TTFB.
Redis Object Caching for Uncached, Logged-In Requests
Additionally, Redis object caching attacks the part of server wait time that full-page cache never reaches. Specifically, it stores the results of repeated database queries in memory, so logged-in dashboards, membership pages, and WooCommerce carts spend less time waiting on the database. As a result, the uncached segment of TTFB drops on exactly the pages that matter most for dynamic sites. The Redis Object Cache plugin connects WordPress to a Redis instance, and pairing it with adequate PHP workers produces the full effect. For a store that runs constant uncached checkout traffic, this combination often decides whether shared hosting still fits or a move to VPS hosting with guaranteed workers is due.
Managed Cloud vs. LiteSpeed cPanel Hosting for Low TTFB
Consequently, the common advice to “just move to managed cloud” for TTFB deserves scrutiny, because the server-layer mechanics that lower first-byte times are available on LiteSpeed cPanel hosting too. The comparison below sets the two approaches side by side on the factors that actually drive TTFB rather than on brand positioning.
| TTFB factor | Managed cloud (plugin-cache model) | LiteSpeed cPanel (AHosting) |
|---|---|---|
| Full-page cache location | Often above PHP or at an edge tier | Server layer, below PHP (LSCache) |
| Cached TTFB | Varies by tier and region | ~16 ms measured median |
| PHP execution handler | Varies; often PHP-FPM | LSAPI, persistent processes |
| Object cache for uncached pages | Add-on or higher tier | Redis available |
| Dedicated IP | Usually paid add-on | Included on every plan |
| Cost model | Premium managed pricing | Standard cPanel pricing |
By contrast, when a site genuinely outgrows shared concurrency, the honest answer is not always another plugin or a pricier managed plan. Instead, moving to a dedicated server with isolated resources removes the noisy-neighbor variability that makes shared TTFB inconsistent. The right destination depends on whether your bottleneck is cache configuration or raw concurrent load, which the diagnostic above is designed to reveal.
A Practical Checklist: Is Your Hosting Built for Low WordPress TTFB?
Finally, use this checklist to judge whether your hosting stack is built to keep first-byte times low. Each item maps to a segment of the TTFB Split, so a gap here predicts exactly where your number will climb.
- Server-level full-page caching that serves below PHP, not a plugin that runs inside a worker.
- A modern PHP handler such as LSAPI that keeps execution overhead low on cache misses.
- Current PHP, ideally 8.3 or 8.4 in line with the WordPress server requirements, since older versions run slower and raise server wait time.
- Redis object caching available for logged-in, membership, and WooCommerce pages that skip full-page cache.
- SSD storage so database and file reads do not become the bottleneck on uncached requests.
- Adequate PHP workers for your concurrency, so TTFB stays stable under repeat requests instead of spiking.
- A dedicated IP and account isolation so a noisy neighbor cannot inflate your server wait time.
Together, these seven properties determine whether your host helps or hurts your first-byte time. If your current plan is missing several of them, the fastest path to a lower number is a stack change rather than another optimization plugin. AHosting builds all seven into every managed WordPress hosting plan, which is why cached responses land near 16 ms without customer configuration. When even that is not enough because uncached concurrency stays high, our guide to the signs your site has outgrown shared hosting covers the upgrade decision in detail.
Frequently Asked Questions: Reducing WordPress TTFB
How do I tell if high WordPress TTFB is my server or my plugins in 2026?
Specifically, request the same URL cached and uncached and compare the wait time. If cached TTFB is low but uncached TTFB is high, the delay lives in PHP execution and your host’s stack, not your browser or plugins. In contrast, if even cached responses are slow, the delay is network or connection related. The TTFB Attribution Table in this guide maps each segment to its owner.
What is a good TTFB for a WordPress site in 2026, and what number signals a server problem?
Generally, a served-from-cache TTFB under about 200 ms is healthy, and under 100 ms is excellent. On AHosting’s LiteSpeed stack, cached WordPress responses measure a median of roughly 16 ms. By contrast, an uncached WordPress request on the same server runs 700 ms to 1,400 ms, so a consistently high TTFB across cached pages points at the server layer rather than a plugin.
Why does my WordPress high TTFB stay high after I install a caching plugin?
Typically, a caching plugin only helps once a page is actually cached and served from cache. First-visit, logged-in, cart, and AJAX requests still run full PHP, so if those uncached paths are slow the plugin cannot mask it. Moreover, on Apache-based hosts the plugin itself runs inside a PHP worker, adding overhead a server-level cache avoids entirely.
How does AHosting’s LiteSpeed with LSCache reduce WordPress TTFB compared to Apache plus a plugin?
Notably, LSCache runs at the LiteSpeed server layer, serving cached pages before PHP starts and consuming zero PHP workers. As a result, cached responses on AHosting measure around 16 ms. In contrast, an Apache host caching above PHP must boot a worker for every hit, which raises both TTFB and concurrency pressure under load.
Does a CDN like Cloudflare fix WordPress high TTFB, or does it hide the real problem?
In practice, a CDN improves TTFB only for cacheable, edge-served requests, and it can mask a slow origin rather than fix it. Ultimately, cache-miss and dynamic requests still fall back to your origin server, so if the origin is slow the CDN merely delays the diagnosis. Test origin TTFB directly to separate the edge from the host, as this guide’s diagnostic explains.
When should I upgrade from shared hosting to VPS to reduce TTFB for a WordPress store with heavy uncached checkout traffic?
Ultimately, upgrade when your uncached TTFB stays above roughly 600 ms during real concurrency and cache cannot cover logged-in or checkout requests. Because carts and account pages bypass full-page cache by design, a store that runs many concurrent uncached requests benefits from the guaranteed workers and memory a VPS provides. The diagnostic in this post shows how to confirm the bottleneck first.
What is the TTFB Split and how does it help diagnose WordPress high TTFB?
Specifically, the TTFB Split is this guide’s method for breaking one TTFB number into three attributable segments: redirect and connection time (network), server wait time (host and PHP), and first-byte delivery (cache hit or PHP run). By attributing each segment to its owner, you learn whether to reduce TTFB WordPress problems at the network, the host, or the application layer instead of guessing.
Can Redis object caching on AHosting reduce WordPress TTFB on pages that never hit the full-page cache?
Yes. Redis object caching stores repeated database query results in memory, which cuts server wait time on uncached, logged-in, and dynamic requests that full-page cache cannot serve. Consequently, membership sites, dashboards, and WooCommerce carts see lower server-side TTFB even though those pages run PHP on every request. Pair it with adequate PHP workers for the full effect.
Is TTFB a Google ranking factor for WordPress sites in 2026?
Indirectly, yes. TTFB is not a named ranking factor, but it feeds directly into Largest Contentful Paint, a Core Web Vitals metric Google uses, so a high server response time drags down the scores that do influence ranking. Furthermore, slow first-byte times reduce crawl efficiency and hurt the AI-search retrieval that increasingly shapes visibility.
How does AHosting keep WordPress TTFB low without asking customers to configure a caching plugin?
Fundamentally, AHosting runs LiteSpeed Web Server, so full-page caching activates at the server layer and pairs with SSD storage and PHP 8.4 over LSAPI for fast execution. Because the cache lives below PHP, cached WordPress pages return in roughly 16 ms whether or not a plugin is configured. The practical checklist near the end of this guide lists every server-side factor that keeps first-byte times low.
Related posts:
 WordPress Hosting Security in 2026: The Server-Level Protection Plugins Can’t Add
 WordPress LiteSpeed Hosting 2026: Why Server-Level Caching Changes Everything
 WordPress Hosting Speed in 2026: The 7 Server-Side Factors No Plugin Can Fix
 WordPress Hosting for Elementor 2026: What the Page Builder Actually Needs From Your Server