
- What "Your Site Could Not Complete a Loopback Request" Actually Tests
- What Stops Working When the Loopback Request Fails
- The AHosting Loopback Error Decoder: What Each Code Means on Shared Hosting
- Why a Loopback Request Fails on Shared Hosting Specifically
- How to Fix a Failed Loopback Request, in Order
- Decode Your Loopback Request Error
- When the Loopback Request Is Not the Problem
- A Practical Checklist for a Failed Loopback Request
- Frequently Asked Questions About the Loopback Request Error
- What does the "WordPress could not complete loopback request" error mean?
- What does the Site Health loopback request test actually send in 2026?
- Loopback request failed vs REST API error: are they the same problem in Site Health?
- Why does the loopback request fail on AHosting shared hosting during a migration before DNS is switched?
- Can Cloudflare Bot Fight Mode make the loopback request return a 403 on a WordPress site?
- What does a 508 status on the loopback request mean on an AHosting Bronze plan?
- cURL error 28 vs cURL error 7 on a loopback request: which one is a firewall?
- Does a failed loopback request stop scheduled posts and WooCommerce emails in 2026?
- How do I test whether loopback requests are working on AHosting without waiting for Site Health?
- Should I disable WP-Cron to fix the loopback request warning in 2026?
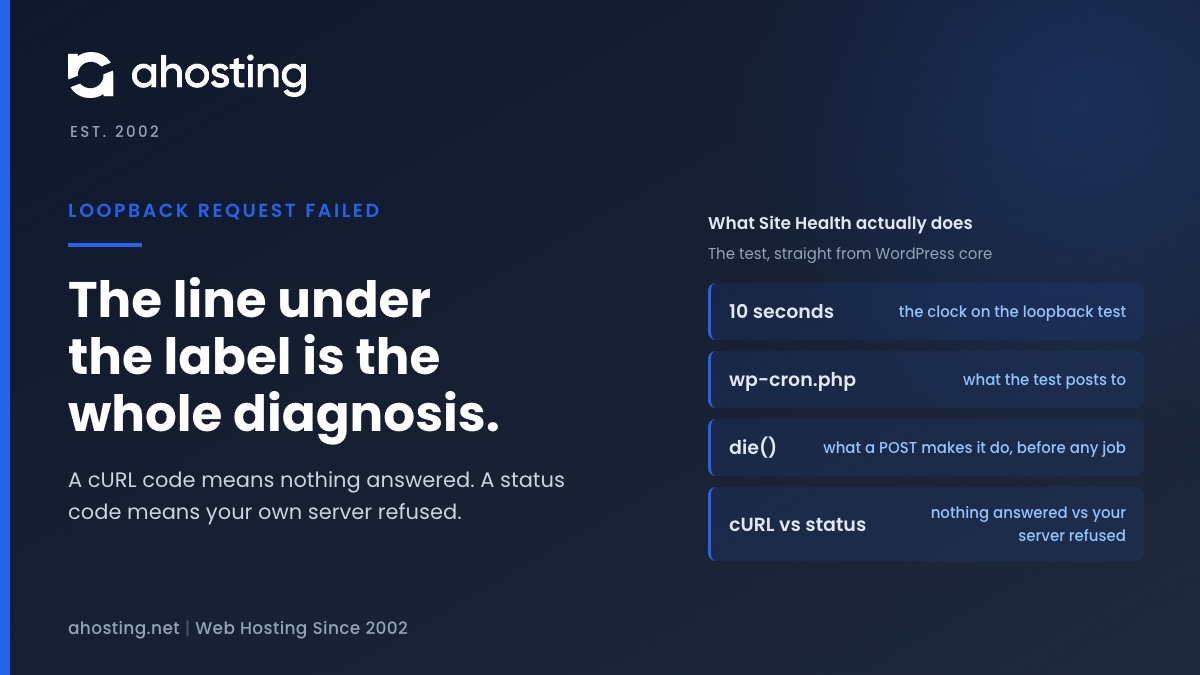
A failed loopback request means WordPress could not reach its own wp-cron.php with a ten-second POST. The code printed under the label is the diagnosis: a cURL error means nothing answered (DNS, firewall, network), a status code means your own server refused (Cloudflare, ModSecurity, a deny rule, or the entry-process ceiling).
The message sits under Critical issues in Site Health and reads like a network fault: your site could not complete a loopback request. Underneath it, WordPress prints one line that most guides skip past, and that line is the whole diagnosis: an error code from cURL, or an HTTP status code from your own server. This guide explains what the loopback request actually is, which features stop working when it fails, what each code means on a cPanel account behind LiteSpeed and CloudLinux, and how to fix the layer the code points at instead of switching plugins off one by one.
What “Your Site Could Not Complete a Loopback Request” Actually Tests
A loopback request is WordPress making an HTTP request to its own public address, the way a visitor would, and the Site Health test checks whether that round trip completes. Core describes the purpose in one sentence: “Loopback requests are used to run scheduled events, and are also used by the built-in editors for themes and plugins to verify code stability.” The test does not check your DNS, your firewall or your CDN by name. It sends one request and reports what came back, which is why the line under the label matters more than the label.
The Loopback Request Is a POST to wp-cron.php With a Ten-Second Clock
Specifically, the method behind the test posts a small body, site-health=loopback-test, to your site’s wp-cron.php, with a ten-second timeout, a Cache-Control: no-cache header, your current cookies, and any HTTP Basic credentials you used to reach wp-admin. Certificate checking is switched off for this request, so an expired or self-signed certificate cannot fail it. And wp-cron.php exits the moment it receives a POST: core checks for a non-empty POST body and calls die() before any scheduled event runs. The request therefore does the WordPress bootstrap and nothing else. A ten-second timeout means the server took ten seconds to start WordPress, or the request never arrived; it never means a cron job was slow.
Critical vs Recommended: Two Different Loopback Request Failures
Two outcomes are reported differently, and the difference is the first clue. If the HTTP client returns an error before any response arrives, the test is marked critical and prints “The loopback request to your site failed, this means features relying on them are not currently working as expected,” followed by the cURL message and its code. If a response arrives with any status other than 200, the test is only marked recommended and prints “The loopback request returned an unexpected http status code” with the number. In practice, a critical result means your server never replied, so look at DNS, the firewall or the network path; a recommended result means your server replied and refused, so look at whatever sits in front of PHP.
What Stops Working When the Loopback Request Fails
The features that depend on the loopback request are mostly invisible until they stop, which is why the warning deserves more attention than its wording suggests. WP-Cron starts by making exactly this kind of request to wp-cron.php during a visitor’s page load, so a site that relies on it loses its scheduler:
- Scheduled posts stay in the queue and show a missed schedule instead of publishing.
- Plugin and theme update checks, and any automatic updates that depend on them, stall until something else runs the schedule.
- WooCommerce’s Action Scheduler stops draining, and with it order emails, subscription renewals and webhook deliveries; on a store this is the first symptom anyone notices, which is why the migration checklist on our WooCommerce plans reviews cron jobs before DNS changes.
- The built-in theme and plugin file editor cannot verify that a saved PHP change did not fatally break the site, so it refuses to keep the change.
- Site Health’s own page-cache test cannot run; core prints “Unable to detect page cache due to possible loopback request problem” in its place.
The REST API test that usually fails alongside it is a separate request, a GET to a route under wp-json, and it shares most of the same causes. Fixing the shared layer first, then re-running Site Health, shows which kind of failure you have.
The AHosting Loopback Error Decoder: What Each Code Means on Shared Hosting
Read the line under the label and find it in the table. Its left column is what Site Health prints; the rest is what that code means when the site runs on a cPanel account behind LiteSpeed and CloudLinux, which is what the generic advice never says.
The Decoder Table
| Site Health prints | What answered | Usual cause on a shared account | Who changes it |
|---|---|---|---|
| cURL error 6 | Nothing: name lookup failed | DNS not pointed yet (migration), expired domain, missing record | You, at DNS |
| cURL error 7 | Nothing: connection refused | Firewall refusing the server its own address; domain pointing elsewhere | Host / you |
| cURL error 28 | Nothing inside ten seconds | Silent firewall or NAT drop; bootstrap slower than ten seconds under throttling | Host / you |
| cURL error 35 | Nothing: TLS handshake failed | TLS negotiation with the server’s own client, not certificate validity | Host |
| cURL error 52 or 56 | A connection that died mid-reply | PHP killed by a memory or process ceiling; connection reset in the path | You / host |
| status 401 | Your server, asking for a password | cPanel Directory Privacy covering wp-cron.php | You |
| status 403 | Your server, or the edge, refusing | ModSecurity rule, .htaccess deny, security plugin, Cloudflare Bot Fight Mode | You / host |
| status 404 | A document root without the file | wp-cron.php deleted; domain resolving to another site | You |
| status 405 | Your server, rejecting POST | A rule allowing only GET on wp-cron.php | You / host |
| status 429 | A rate limit | Plugin or edge rule counting the server as a client | You |
| status 500 or 503 | PHP, or the web server on its behalf | Fatal error at bootstrap; memory or process limit; resource ceiling | You |
| status 508 | CloudLinux: Resource Limit Reached | Every entry process occupied at that instant by uncached requests | You |
| completed successfully | wp-cron.php, with 200 | Not a loopback problem: missed jobs are a cron trigger problem | You |
Critical Loopback Request Failures: the cURL Codes
A cURL code means the HTTP client gave up before a response arrived, and the libcurl error list defines each one precisely. Error 6, “Could not resolve host,” means the server could not turn your domain name into an address at all; on shared hosting that is almost always a domain whose DNS has not been pointed yet, or a domain that has expired. Next comes error 7, “Failed to connect() to host or proxy,” which means the connection was refused: a firewall rejecting the server’s own public address, or a domain resolving to a machine that is not this one. The common one is error 28, “Operation timeout,” meaning the request went out and nothing came back inside ten seconds. cPanel’s own support article on this exact WordPress message says “An incorrect NAT, firewall, or other security configuration can cause it,” and that is the usual shape: a firewall that drops rather than rejects. The other cause is a WordPress bootstrap slower than ten seconds, which happens on an account that is being throttled, and the cPanel article is worth reading because it names the firewall half plainly. Error 35 is a TLS handshake the server’s own client could not complete, unrelated to certificate validity since verification is off; errors 52 and 56 mean the connection opened and then produced nothing usable, which on a shared account most often means the PHP process serving the loopback was killed by a memory or process ceiling mid-request.
Recommended Loopback Request Failures: the Status Codes
A status code means something answered, and the number tells you what. The 401 is HTTP authentication: cPanel’s Directory Privacy on a staging copy covers wp-cron.php along with everything else, and while Site Health forwards the credentials you logged in with, a scheduled check has none. Next, 403 is a refusal, and it has four common sources on this stack: a ModSecurity rule that matched the POST, a deny rule on the file in .htaccess, a security plugin that treats the server’s own address as an attacker, and a Cloudflare challenge if the domain is proxied. With a 404, the document root that answered has no wp-cron.php, either because it was deleted as a hardening step or because the domain resolves to a different site. On a 405, POST is not allowed on that path, which is a rule permitting only GET. The 429 is a rate limit counting the server as a client. Then 500 or 503 is PHP failing at bootstrap or the web server refusing to run it, and on this platform a 503 can also be a resource ceiling. Finally, 508 is CloudLinux itself, and it gets its own section below.
Why a Loopback Request Fails on Shared Hosting Specifically
Four of the causes in the decoder are far more common on a shared account than on a server you administer yourself, because each one is a layer you do not control or a layer you share. Knowing which of the four you are looking at decides whether the fix is a setting of yours or a ticket.
DNS During a Migration Sends the Loopback Request to the Old Host
The loopback request goes to your public domain name, not to the server it runs on. While your DNS still points at the previous host, WordPress on the new account resolves that name to the old address and sends the request there, and whatever the old host returns becomes your Site Health result: a 404, a 403, a 200 from the wrong site, or a timeout. Nothing is wrong with the new account. This is the single most common way the warning appears the day a site moves, and our guide to moving a WordPress site without downtime puts the Site Health check after the DNS switch for this reason. On a shared account there is no per-site hosts file to force the name to resolve locally before the switch; that control is one of the things a VPS with root access gives you, and it matters most to agencies that migrate sites every week.
Cloudflare Bot Fight Mode Challenges Your Own Server’s Loopback Request
When the domain is proxied through Cloudflare, the loopback request leaves your server, resolves your domain to Cloudflare’s edge, and arrives there as automated traffic carrying a WordPress user agent. That is precisely what Bot Fight Mode exists to challenge, and Cloudflare’s documentation is direct about the consequences: the feature protects entire domains “without endpoint restrictions,” it “may challenge API or mobile app traffic,” and “You cannot bypass or skip Bot Fight Mode using WAF custom rules or Page Rules.” The same page gives the way out: Super Bot Fight Mode “runs on the Ruleset Engine and supports Skip rules,” so a skip for wp-cron.php becomes possible there, or the feature is turned off. Our write-up of running LiteSpeed Cache behind Cloudflare covers the rest of what the proxy changes on this stack.
ModSecurity Rules and .htaccess Denies on wp-cron.php
A web application firewall in front of PHP inspects the loopback POST like any other request, and a rule can match it. The OWASP Core Rule Set documentation calls this a false positive, “When a genuine transaction causes a rule from CRS to match in error,” and notes that false positives “need to be tuned away by writing rule exclusions.” Its worked example is a WordPress request. If your cPanel shows a ModSecurity item under Security, it lists every hit with its rule ID and lets you switch the engine off per domain to confirm the diagnosis; if it does not, the rule log is readable only on our side, and a ticket with the timestamp is how it gets read. Either way the durable fix is an exclusion for that rule ID, which is a ticket. Separately, a hardening guide from years ago may have left a deny rule on wp-cron.php in .htaccess, or a rule that allows only GET, and those produce the 403 and 405 rows respectively. Search the file for the filename before looking anywhere else.
The Entry-Process Ceiling: When the Loopback Request Gets a 508
The loopback request is one more PHP request from your own account, made at the instant the test runs. CloudLinux caps the number of those that can run at once, and its own knowledge base states what happens at the cap: “Once the number of entry processes (Apache/HTTP requests is reached), a user will get a 508 “Resource Limit Reached” error message.” So a 508 in Site Health means every slot was occupied when the test fired. Two facts about our platform make that easier to read. A page served from LiteSpeed’s cache consumes no entry process at all, so the slots are filled only by uncached requests: wp-admin, logged-in views, carts, checkouts, AJAX and bots. And the ceilings are published per plan on our shared hosting plans, so the arithmetic can be stated rather than guessed:
| Plan | Entry processes | Slots one Site Health loopback test holds | Uncached requests in flight before the test sees a 508 |
|---|---|---|---|
| Bronze | Up to 30 | 2 (the test request and its loopback) | 28 |
| Silver | Up to 40 | 2 | 38 |
| Gold | Up to 50 | 2 | 48 |
A 508 during the test is therefore a load reading, not a network fault, and our guide to the 508 Resource Limit Reached error explains how to find what was uncached at that moment. The same ceiling is why WP-Cron itself competes with visitors for a slot; the measured case for a server cron shows what that costs and how to move the schedule off the loopback path entirely.
How to Fix a Failed Loopback Request, in Order
Work in this order and stop when Site Health passes. The first step costs a minute and usually names the layer; the second is the fix for that layer; the third confirms the features that depend on the loopback request are actually working again.
First Step: Reproduce the Loopback Request From Outside the Server
The test is an ordinary HTTP request, so you can make the same one from your own computer and compare. From a terminal, run curl -s -o /dev/null -w "%{http_code} %{time_total}\n" -X POST -d "site-health=loopback-test" https://yourdomain.com/wp-cron.php. Beside it, run dig yourdomain.com, the DNS lookup utility documented in the ISC BIND manual pages, so you know which address the request would have reached. A 200 in well under a second from outside, beside a failure inside Site Health, means the path works for visitors and is broken only from the server itself, which points at DNS resolution on the server or at a rule that treats the server’s own address differently. Getting a 403 from outside as well means the block is in front of everyone, and seeing a slow result from outside as well means the account is slow to boot WordPress, which is a throttling question.
Second Step: Fix the Layer the Loopback Request Code Names
- DNS (error 6, or the wrong site answering): confirm the domain resolves to this server from your own computer. If it does not, the record is the fix; if you are mid-migration, wait for propagation and test again.
- Cloudflare (403 with the proxy on): open Security, then Analytics, and look for the request labeled Bot Fight Mode at the time of the test. Turn it off, or move to Super Bot Fight Mode and add a skip rule for wp-cron.php.
- ModSecurity (403 with nothing else to explain it): if cPanel shows a ModSecurity item under Security, note the rule ID of the hit, switch the engine off for the domain, re-run the test, then switch it back on and ask for an exclusion for that rule ID; if it does not, open a ticket with the timestamp and the rule log gets read on our side.
- Rules of your own (403, 405): search .htaccess for wp-cron.php and remove any deny or method restriction; check security plugins for a block on your server’s own IP or on unauthenticated requests to the file.
- Directory Privacy (401): remove the protection or exclude wp-cron.php from it.
- Firewall (error 7 or 28 from Site Health, 200 from outside): open a ticket with the exact line. This is a server-side path and only the host can see it.
- Entry processes (508): open the resource usage page, find the entry-process faults at the time of the test, and reduce what is uncached before retrying.
Third Step: Re-run Site Health, Then Test Cron Directly
Go to Tools, then Site Health, and re-run the Status tab; the loopback test runs asynchronously, so give it a moment. Then test the feature that matters rather than the test that flagged it: if WP-CLI is available in your cPanel terminal, wp cron test performs the spawn check WordPress itself uses, and wp cron event list shows whether events are still overdue. If the loopback request now passes and events still miss, the schedule trigger is the problem and a server cron is the answer. If the test still times out from inside the server after the firewall has been ruled out, the bootstrap itself is slow, and disk I/O throttling is the cause that produces exactly that symptom without printing an error anywhere.
Decode Your Loopback Request Error
Pick the line Site Health printed, say whether the domain is proxied through Cloudflare, and pick your plan. The decoder tells you which layer answered, what most often causes it on this stack, who can change it, and the first thing to do.
Loopback Error Decoder
Pick the line Site Health printed under the label, say whether your domain is proxied through Cloudflare, and pick your plan. It tells you which layer answered, what most often causes it on a cPanel account behind LiteSpeed and CloudLinux, who can change it, and the first thing to do.
Which layer answered:
Most likely on a shared account:
Who can change it:
Do this first:
The decoder reads the code the way the Site Health test produces it: a cURL code means no HTTP response arrived inside ten seconds; a status code means a response arrived and was not 200. It cannot see your logs, so treat the cause as the first thing to rule out, not a verdict.
When the Loopback Request Is Not the Problem
Two situations look like this warning and are not. The first is a loopback request that passes while scheduled jobs still miss: that is WP-Cron’s page-load trigger on a quiet or fully cached site, or a DISABLE_WP_CRON constant with no server cron behind it, and the fix is a cron job in cPanel that runs WP-CLI on a fixed interval. The second is a REST API failure with the loopback passing, which is almost always a security plugin or a rule that blocks unauthenticated access to wp-json, not a network path.
That column in the decoder, “who changes it,” is honest about where the line falls. DNS records, Cloudflare settings, .htaccess, plugins and Directory Privacy are yours; the server firewall, a ModSecurity exclusion and the TLS layer are ours, and a ticket carrying the exact line from Site Health is what our support works from, around the clock. What takes the loopback request out of the picture for good is on every plan we sell: cron jobs in cPanel, so the schedule runs from the server rather than from a page load, and on our managed WordPress plans a jailed shell with WP-CLI to run it and to test it in one line. The reading above is what we would do on the ticket; the server cron is what you can set up tonight, and the reason the warning stops mattering even before it is cleared.
A Practical Checklist for a Failed Loopback Request
- The line under the label has been read and written down, code and all, before anything was changed.
- The same POST to wp-cron.php has been made from outside the server, and its status code and time were compared with Site Health’s result.
- The domain has been confirmed to resolve to this server from your own computer, and if a migration is in progress, the test has been deferred until after the DNS switch.
- If the domain is proxied through Cloudflare, Security Analytics has been checked for a Bot Fight Mode challenge on the request.
- cPanel has been checked for a ModSecurity item under Security, and any hit at the time of the test has had its rule ID noted for an exclusion.
.htaccesshas been searched for wp-cron.php, and any deny or method restriction removed.- Directory Privacy is not covering the WordPress directory, or wp-cron.php has been excluded from it.
- For a 508, the resource usage page has been checked for entry-process faults at the time of the test, and the uncached traffic filling the slots has been identified.
- For a critical result that passes from outside, a ticket has been opened with the exact line, because the remaining causes are server-side.
- Scheduled jobs have been moved to a server cron running WP-CLI, so they no longer depend on the loopback request at all.
Frequently Asked Questions About the Loopback Request Error
What does the “WordPress could not complete loopback request” error mean?
Specifically, it means WordPress tried to make an HTTP request to its own public address, the way a visitor would, and that request either never got an answer or got an answer other than 200. The test behind the message posts a tiny body to your site’s wp-cron.php and gives it ten seconds. Because wp-cron.php exits the moment it sees a POST, the request only exercises DNS, the network path, whatever sits in front of PHP, and the WordPress bootstrap itself. The line printed underneath the label carries the actual diagnosis: a cURL error code when nothing came back, or an HTTP status code when your own server refused.
What does the Site Health loopback request test actually send in 2026?
In practice it sends one POST request to your site’s wp-cron.php with the body site-health=loopback-test, a Cache-Control no-cache header, your current cookies, any HTTP Basic credentials you used to reach wp-admin, and a ten-second timeout. Certificate verification is switched off for this request, so an expired or self-signed certificate cannot fail it. That is the whole test: no DNS lookup of its own, no firewall probe, no cron job. If the request returns 200 the test passes, if it returns any other status the test is marked recommended, and if the HTTP client errors before a response arrives the test is marked critical.
Loopback request failed vs REST API error: are they the same problem in Site Health?
Typically they share a cause but they are two different requests. The loopback test posts to wp-cron.php; the REST API test fetches a route under wp-json with the current user’s cookies and nonce. Both leave the server, resolve your domain, come back in through whatever sits in front of PHP, and boot WordPress. So a firewall, a DNS mismatch or a Cloudflare challenge usually fails both at once, while a security plugin that blocks unauthenticated REST access or a rule that only denies wp-cron.php fails exactly one. Fixing the shared layer first, then re-running Site Health, tells you which kind you have.
Why does the loopback request fail on AHosting shared hosting during a migration before DNS is switched?
Notably, the loopback request uses your public domain, not the server it is running on. While your domain’s DNS still points at the old host, WordPress on our server resolves that name to the old host’s address and sends the request there. Depending on what the old host does with it, Site Health reports a 404, a 403, a 200 from the wrong site, or a timeout. Nothing is broken on the new account; the test is simply being answered by the wrong server. Once the DNS change has propagated the same test passes without any change on our side, which is why we recommend running Site Health only after the switch.
Can Cloudflare Bot Fight Mode make the loopback request return a 403 on a WordPress site?
Indeed it can, and it is one of the most common causes on a domain proxied through Cloudflare. The loopback request leaves your server, resolves your domain to Cloudflare’s edge, and arrives there as automated traffic from a WordPress user agent, which Bot Fight Mode is designed to challenge. Cloudflare’s own documentation says the feature protects the whole domain without endpoint restrictions, may challenge API traffic, and cannot be bypassed with WAF custom rules or page rules. The practical fixes are to turn Bot Fight Mode off, or to move to Super Bot Fight Mode, which runs on the ruleset engine and does honor skip rules for wp-cron.php.
What does a 508 status on the loopback request mean on an AHosting Bronze plan?
In fact a 508 on the loopback request is your own entry-process ceiling talking. A Bronze account allows up to 30 concurrent PHP requests, and the loopback is one more PHP request from the same account, made at the instant the test runs. When every slot is already occupied, CloudLinux refuses the new request with 508 Resource Limit Reached, and Site Health reports it as a recommended issue with that number. Because a page served from LiteSpeed’s cache consumes no entry process at all, a 508 during the test means uncached requests were filling the account at that moment, and the fix is to find them rather than to retry the test.
cURL error 28 vs cURL error 7 on a loopback request: which one is a firewall?
By contrast with what the numbers suggest, either can be a firewall, and the difference is how the firewall behaves. Error 7 means the connection was refused outright: something answered the connection attempt with a rejection, or nothing was listening at the address the domain resolved to. Error 28 means the request was sent and then waited the full ten seconds with no answer, which is what a firewall that silently drops packets produces, and also what a server that takes longer than ten seconds to start WordPress produces. So a 7 points at the address or an active refusal, while a 28 points at a silent drop or a slow bootstrap, and the test from outside the server tells you which.
Does a failed loopback request stop scheduled posts and WooCommerce emails in 2026?
Ultimately yes, when the site relies on WP-Cron, because WP-Cron itself is started by a loopback request to wp-cron.php on a visitor’s page load. If that request cannot complete, scheduled posts stay in the queue and show a missed schedule, plugin update checks stall, and WooCommerce’s Action Scheduler queue, which carries order emails, subscription renewals and webhook deliveries, stops draining. The Site Health warning is therefore an early signal of a problem you would otherwise discover from a customer. A server cron that calls WP-CLI directly does not depend on the loopback request and keeps those jobs running even while the test fails.
How do I test whether loopback requests are working on AHosting without waiting for Site Health?
Fortunately the test is easy to reproduce from any computer, because the loopback request is an ordinary HTTP request. Run curl against your own domain with the same shape Site Health uses: a POST to wp-cron.php with the body site-health=loopback-test, and look at the status code. A 200 with an empty body from outside the server, alongside a failure inside Site Health, means the path is fine for visitors and broken only from the server itself, which points at DNS resolution on the server or at a rule that treats the server’s own address differently. If WP-CLI is available in your cPanel terminal, wp cron test performs the spawn check WordPress itself uses and reports the result in one line.
Should I disable WP-Cron to fix the loopback request warning in 2026?
That said, disabling WP-Cron does not clear the warning, because the test still posts to wp-cron.php whether or not the constant is set, and the file still answers. What disabling WP-Cron does is remove your scheduled jobs from the loopback path, so a server cron that runs WP-CLI keeps them going while you fix the underlying block. That is a sensible first move on a store or any site with time-critical jobs, and it is the right permanent setup on shared hosting regardless. The warning itself is fixed at the layer the error code names: DNS, the firewall, a Cloudflare setting, a ModSecurity rule, a deny rule on the file, or the account’s entry-process ceiling.
Related posts:
 Autoloaded Options Could Affect Performance: How to Read the Site Health Warning and Clear It on Shared Hosting
 7 Signs Your WordPress Site Has Outgrown Shared Hosting (Is It Time for WordPress VPS Hosting?)
 “Resource Limit Reached” vs. 503 vs. 500 Error WordPress: A Diagnostic Decision Tree
 Why Raising the WordPress Memory Limit Doesn’t Work on Shared Hosting (and What Does)