
- What Page Cache Is Not Detected Actually Means
- How Site Health Decides That Page Cache Is Not Detected
- The Headers Site Health Accepts as Proof of a Page Cache
- Why a Working Cache Still Shows Page Cache Is Not Detected
- Why Site Health Can Report a Page Cache That Does Not Exist
- What Our Own Blog Returned When We Asked Three Times
- How to See Exactly What the Page Cache Test Saw
- How to Fix Page Cache Is Not Detected on LiteSpeed, Nginx and Behind a CDN
- A Practical Checklist for Page Cache Is Not Detected
- Frequently Asked Questions About Page Cache Is Not Detected
- How do I fix page cache is not detected in WordPress Site Health?
- Why does Site Health say page cache is not detected on a cached site in 2026?
- Is page cache is not detected but the server response time is OK safe to ignore?
- Does AHosting LiteSpeed hosting ever show page cache is not detected?
- Page cache vs object cache: which one does this Site Health check actually measure?
- LiteSpeed Cache vs a Cloudflare edge cache: which one does Site Health see?
- Will an AHosting plan upgrade fix a slow page cache is not detected result in 2026?
- Can I add my own cache header so the page cache check passes?
- Does AHosting count cached pages against my entry process limit?
- Does page cache is not detected affect SEO or Core Web Vitals in 2026?
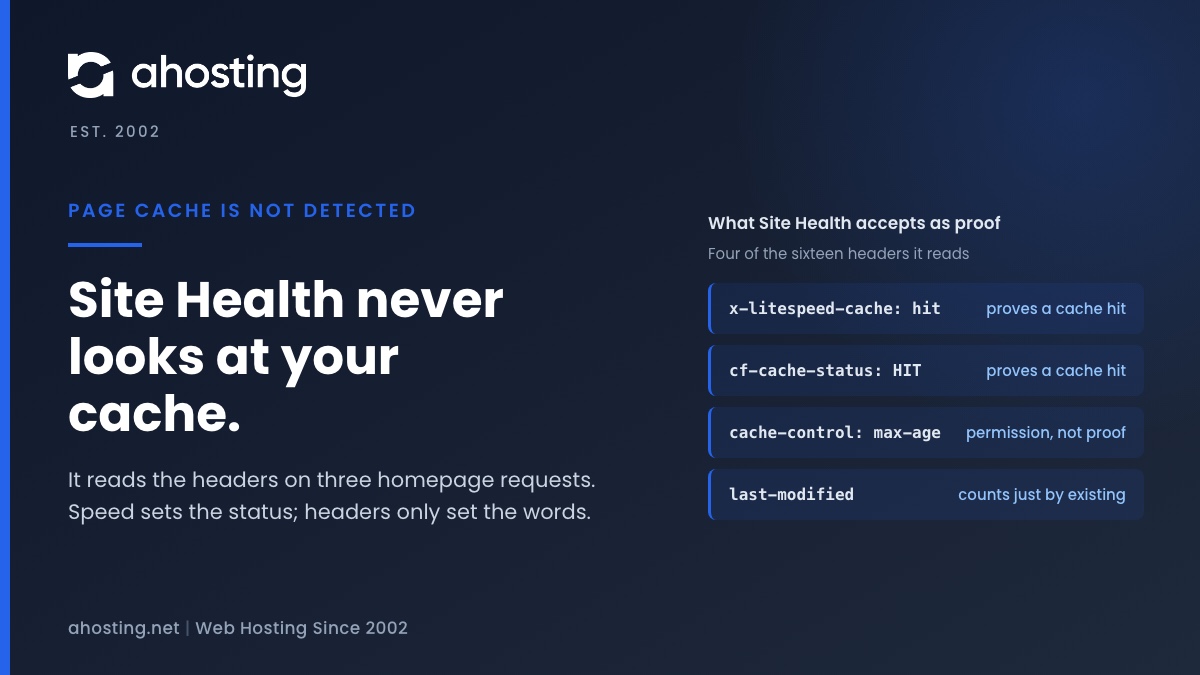
Site Health decides whether you have a page cache by requesting your homepage three times from your own server and looking for a caching header, or for a cache drop-in file. It never looks at the cache itself. So the message can appear on a site that is cached perfectly well, and it can stay silent on a site with no cache at all. Response time alone decides whether the result is a recommendation or critical. Read the headers your homepage actually returns and you will know in a minute which of the two you have.
What Page Cache Is Not Detected Actually Means
When WordPress Site Health prints Page cache is not detected but the server response time is OK, it is reporting the outcome of one small experiment and nothing more. Your server fetched your own homepage three times, timed each answer, and looked through the response headers for a sign that a cache had served it. It found none. That is the whole finding. It is not a measurement of your cache, which the test never inspects, and it is not a verdict on your hosting. It is a statement about which headers came back.
The Four Labels the Page Cache Test Can Print
The same test produces four different headings, and people searching for one of them are usually looking at another. The difference matters, because two are recommendations and two are critical, and the thing that separates them is not the cache at all. It is the clock. The table below is read straight from the WordPress 7.1.2 source.
| Label Site Health prints | Status | Median response time | Cache signal found |
|---|---|---|---|
| Page cache is detected and the server response time is good | Good | Under 600 ms | Yes |
| Page cache is not detected but the server response time is OK | Recommendation | Under 600 ms | No |
| Page cache is detected but the server response time is still slow | Critical | 600 ms or more | Yes |
| Page cache is not detected and the server response time is slow | Critical | 600 ms or more | No |
Why Page Cache Is Not Detected Is a Recommendation, Not a Failure
Look at the second row again. A site can have no cache whatsoever and still land in the recommendation band, provided its homepage answers in under 600 milliseconds. And a site with a working cache lands in the critical band the moment its median crosses that line. So the common reading of this notice, that WordPress has found a problem with your cache, is backwards. It has found a fast site with no visible cache, and it is suggesting you add one before traffic makes the speed disappear.
How Site Health Decides That Page Cache Is Not Detected
Every guide to this message starts at the fix. Starting at the test is quicker, because the test is short, the rules are fixed, and once you know them you can predict the result without opening the dashboard. Three decisions produce every outcome: what gets requested, what counts as evidence, and which timing gets compared with the threshold.
Three Requests to Your Own Homepage
The test calls your own site address, the homepage and only the homepage, three times in a row from the server itself. Each request is sent with no login cookie, so it sees what an anonymous visitor sees rather than what you see in the dashboard. If any one of the three errors, or returns a status other than 200, the test stops at once and prints Unable to detect the presence of page cache, adding that loopback requests may be the problem. That wording is exact, and we covered what sits behind it in the guide to the loopback request error. A homepage that redirects to a login screen, or a maintenance page, ends the test here.
Sixteen Headers and One File
For each of the three responses, WordPress walks a list of sixteen header names and records any that are present and pass their rule. Separately, it checks whether a file named advanced-cache.php exists in the content directory while caching is switched on in the configuration, which is the drop-in mechanism older cache plugins used to intercept requests. Either piece of evidence is enough. The headers from all three responses are merged into one set, so a single qualifying header on any single request counts as found for the whole test. That merge is why a cold cache usually still passes.
The Median, and Why One Slow Request Does Not Fail You
The three timings are sorted from slowest to fastest and the middle one is kept. One slow outlier, such as the first request warming an empty cache, is thrown away by construction. That middle value is then compared with 600 milliseconds, a default taken from the published guidance on time to first byte and adjustable through its own filter. The measured time includes the whole round trip from your server back to itself, connection and encryption setup included, so it is not purely the time PHP spent building the page.
The Headers Site Health Accepts as Proof of a Page Cache
Not every header on the list is judged the same way. Some must carry a particular value, and a few count simply by existing. Knowing which is which explains most of the confusing results people report, in both directions. The table is the list as it ships in WordPress 7.1.2, grouped by the rule applied, with the software that typically sends each one.
| Header | What makes it count | Typically sent by |
|---|---|---|
x-litespeed-cache | The value contains HIT | LiteSpeed web server with LSCache |
cf-cache-status | The value contains HIT | Cloudflare |
x-cache | The value contains HIT | Fastly and many other proxies |
x-cache-status, x-proxy-cache | The value contains HIT | Nginx proxy or FastCGI cache, if configured to send it |
x-srcache-fetch-status, x-srcache-store-status | HIT, or STORE for the second | OpenResty srcache module |
x-varnish | Two or more request IDs in the value | Varnish |
cache-control | A max-age of one second or more | Almost any server or plugin |
expires | A date in the future | Almost any server or plugin |
age | A number above zero | Shared caches and CDNs |
last-modified, etag, via | Present at all, any value | Web servers and proxies, cached or not |
x-cache-enabled, x-cache-disabled | true, or anything other than on | Rarely anything; core itself notes these seem unused |
Why a Working Cache Still Shows Page Cache Is Not Detected
The frustrating version of page cache is not detected is the one on a site you know is cached. It happens because the test looks for evidence rather than for the cache, and several perfectly good setups no longer leave the evidence it expects. Each of the four below is visible in the response headers, and none of them is fixed by installing a second cache plugin.
LiteSpeed Cache Stopped Writing the Drop-In File
For years, a cache plugin announced itself to this test by leaving advanced-cache.php behind. LiteSpeed Cache removed its use of that file in version 7.4, released in August 2025, because the plugin no longer needs it on modern WordPress. We confirmed the change in the plugin changelog and source for version 7.9.1. The consequence for this test is direct: on a LiteSpeed site the drop-in route is gone, and the only remaining proof is the X-LiteSpeed-Cache response header reading hit. The plugin also registers that header, and two related ones, with Site Health through the supported filter. So if none of the three requests is served from cache, a site running LiteSpeed will show page cache is not detected even though the cache is installed.
A Custom Proxy Header Site Health Has Never Heard Of
Nginx does not send a cache status header by default. Administrators add one, and they name it whatever they like. The widely copied examples in the NGINX caching guide use X-Cache-Status, which is on the list, but a header named after the FastCGI cache, or after the hosting company, is not. Your cache works, visitors get cached pages, and the test reports page cache is not detected because the one header announcing it has a name WordPress was never told about.
The Homepage Is the One Page Not Being Cached
Page cache is not detected on a cached site very often means the homepage is the exception. The test only ever requests the homepage. Sites that exclude the front page from caching, because it shows a live feed, a rotating offer or a geolocated banner, are cached everywhere else and uncached on the single address the test checks. A cache status reading MISS on all three requests is the fingerprint. So is a homepage that sets a cookie on every visit, since many caches refuse to store a response that sets one.
A Staging Copy Never Runs the Test at All
Core only registers the page cache test when the environment type is production. On a site marked as staging or development, the test is absent rather than failing, which surprises people comparing a live site with its copy. If you are testing a cache change on a staging site, read the headers directly rather than waiting for a Site Health result that will never appear.
Why Site Health Can Report a Page Cache That Does Not Exist
The opposite error gets less attention, and it is the more dangerous one, because a green result stops people looking. The rules that accept evidence are generous enough that a site with no page cache of any kind can pass, and the passing notice lists the headers that satisfied it without saying how weak some of them are.
Three Headers Count Just by Being Present
For last-modified, etag and via, core defines no rule at all, which means presence alone is treated as proof. None of the three indicates a page cache. A Last-Modified date can be sent by any theme or plugin that knows when a page last changed. An ETag is a version tag a server may attach to any response. A Via header only says that a proxy relayed the response, not that it stored it. Any one of them, on any one of the three requests, is enough for the test to report a cache.
A Browser Cache Instruction Is Not a Page Cache
The rule for cache-control only asks for a max-age of one second or more. It does not check who the instruction is for. A response marked private, which tells shared caches not to store it and allows only the visitor’s own browser to keep a copy, passes the test just as well as one a CDN is actually serving. So does a max-age that a theme adds to every response while the server still builds each page from scratch. The header describes what a cache is allowed to do, not what any cache did.
What Our Own Blog Returned When We Asked Three Times
Rather than describe in the abstract how Site Health concludes that a page cache is not detected, we ran its three requests against this blog on 23 September 2026, from outside the server the way a visitor would, and read what came back. The blog sits behind Cloudflare, which makes it a useful example: one layer, several headers, and a first request that behaves differently from the rest.
A Miss, Then Two Hits
The first request came back in 596 milliseconds with cf-cache-status: MISS, which means the edge had no stored copy and fetched one. The second and third came back in 169 and 244 milliseconds, both reading cf-cache-status: HIT. All three carried cache-control: public, max-age=300 and a last-modified date. The second and third also carried age: 0, which fails its rule, because zero is not above zero. A single-request check run at the wrong moment would have reported no cache at all.
What Site Health Would Make of It
Apply the rules and the result is easy to predict. Sorted from slowest to fastest the timings are 596, 244 and 169, so the median is 244 milliseconds, comfortably under the threshold. Three headers qualify once the responses are merged: the Cloudflare HIT, the max-age of 300, and the last-modified date. The label would be Page cache is detected and the server response time is good. Notice that two of those three would have been present with the edge cache switched off, which is the false-positive problem in miniature. The HIT is the only one that proves anything.
How to See Exactly What the Page Cache Test Saw
You do not need Site Health to reproduce its verdict, and reproducing it yourself is faster than rerunning the test from the dashboard, because you see every header rather than a summary. Three methods work, in rising order of how closely they match what the test actually receives.
Repeat the Three Requests From a Terminal
From any machine, run curl -sI https://example.com/ three times in a row, replacing the address with your own homepage, and compare the headers. Look for a cache status reading HIT on the second or third attempt. If you see one, a cache is serving that page. Should all three read MISS, something is stopping the homepage from being stored. When no status header appears at all, either no cache sits in front of the site or it reports under a name you will need to look up. REDbot reads the same headers in a browser and explains each one, if a terminal is not to hand.
Ask From Inside the Server
The test runs on your server, not on your laptop, and the two can take different routes. If your domain resolves straight back to the origin from inside the server, the loopback never passes through the CDN, and the CDN header you see from home will not reach the test. On a plan with shell access, running the same command on the server shows the test’s own view. Without shell access, the test’s summary lists the headers it detected by name, which is the same information after the fact.
Read the Header Documentation for Your Layer
Every cache that sends a status header documents its values, and the values are where the surprises are. Cloudflare’s cache response reference explains why an HTML page often reads DYNAMIC rather than MISS, which means the page was never eligible to be stored in the first place. The Fastly X-Cache reference covers the combined values a two-tier cache sends. The Varnish HTTP notes explain why its header counts only when it carries two numbers.
How to Fix Page Cache Is Not Detected on LiteSpeed, Nginx and Behind a CDN
With the headers in front of you, the fix for page cache is not detected is specific to what they said. Enter your three observations in the predictor below to see the label Site Health will print and the first thing to change, then use the table after it to match your stack to the fix.
Site Health Page Cache Result Predictor
Request your homepage three times and note what came back. Enter it here and this applies the same decision rules WordPress 7.1 uses, so you can see which label Site Health will print, why, and what to change first.
Status:
Why:
Do this first:
This mirrors the rules in the WordPress 7.1.2 source and nothing else, so it cannot see your site. A plugin can add headers to the accepted list, which would change the result for the better.
Fixes by Stack When Page Cache Is Not Detected
| What your headers showed | Likely cause | Fix | What not to do |
|---|---|---|---|
LiteSpeed server, no x-litespeed-cache header at all | The LiteSpeed Cache plugin is not active, so nothing tells the server what to store | Activate the plugin and enable caching, then request the homepage twice | Install a second cache plugin alongside it |
x-litespeed-cache: miss on every request | Homepage excluded, a cookie set on every visit, or a cache purged by each test run | Check the exclusion lists and look for a plugin that sets a cookie on the front page | Assume the server cache is broken |
| Nginx cache working, but its status header has a custom name | The header is not on the accepted list | Rename it to X-Cache-Status, or register it through the filter | Add a fake header that does not track the real cache state |
Cloudflare reads DYNAMIC on the homepage | HTML is not eligible for edge caching under the current rules | Add a cache rule for HTML with the admin and login paths excluded | Cache every path including the admin area |
| No caching headers of any kind, from any layer | No page cache exists | Turn one on at the server level where the host provides it | Stack two page caches that each hold their own copy |
Registering a Header the Test Does Not Know
When your cache works and simply reports under an unfamiliar name, core offers the site_status_page_cache_supported_cache_headers filter for exactly this case. A short snippet in a site plugin adds the header and a rule for reading it, for example $headers['x-fastcgi-cache'] = function ( $v ) { return false !== stripos( $v, 'hit' ); }; followed by returning the array. Register the header your cache genuinely sends and read its real HIT value. A rule that returns true for any value turns the test into a decoration.
When the Slow Half of the Message Is the Real Problem
If the label ends in response time is slow, the status is critical and the cache is only half the story. An uncached homepage that takes 600 milliseconds or more is usually waiting on PHP and the database, and a page cache fixes that by skipping both. A cached homepage that is still slow is waiting on something in front of PHP, and caching harder will not help. We separated those two cases in detail in the guide to reducing time to first byte, and the split there applies directly to this result.
A Practical Checklist for Page Cache Is Not Detected
- Read the full heading, not the first four words. Recommendation or critical is decided by the median response time, and that tells you whether this is urgent.
- Request your homepage three times and note every caching header. A HIT on any request means a cache is working and the test is failing to recognize it.
- If a request fails or returns anything other than 200, fix the loopback or the redirect before touching the cache.
- On LiteSpeed, confirm the LiteSpeed Cache plugin is active, because the drop-in file the test once looked for no longer exists.
- On a custom proxy, compare its status header name with the accepted list, and rename it or register it if it is missing.
- If the only headers are Last-Modified, ETag or Via, treat a passing result as unproven until a real cache status header appears.
- After any change, request the homepage twice more and confirm the second request reads HIT before rerunning Site Health.
Why a Page Cache Matters More on Shared Hosting
A fast result reading page cache is not detected is real, and it is also a measurement of one visitor at a time. What an uncached page costs on shared hosting is concurrency. Every uncached visit holds one PHP process for as long as the page takes to build, and our shared hosting plans publish that ceiling rather than hiding it: up to 30 concurrent PHP processes on Bronze and 40 on Silver. A burst of visitors to an uncached homepage fills those quickly, and the symptom is the queueing we traced in the guide to PHP workers and 503 errors. A cached visit holds none of them.
Where the Work Stops Being Yours
What we take off your hands is the layer the test is looking for. Every one of our WordPress plans runs on LiteSpeed with LSCache included, and a page served from LSCache consumes no PHP process at all, so the ceiling above is reserved for the requests that genuinely need PHP. The headers, the exclusions and the plugin switch are yours to check, and this guide covers all of them. Where a store is doing the work, the WooCommerce plans start from a larger allocation, because carts and checkouts can never be served from cache. And where a site has outgrown shared limits even with caching on, a VPS is the honest next step.
Frequently Asked Questions About Page Cache Is Not Detected
How do I fix page cache is not detected in WordPress Site Health?
Typically by finding out which of two things is missing rather than by installing another plugin. Site Health accepts a cache as present when the homepage returns one of a fixed list of caching headers, or when a cache drop-in file exists and caching is switched on in the configuration. Request your homepage three times from a terminal and read the headers. If a header saying HIT appears, your cache works and the test simply does not recognize it. If nothing appears at all, no cache is serving that page and turning one on is the actual fix.
Why does Site Health say page cache is not detected on a cached site in 2026?
Specifically because the test looks for evidence of a cache, not for the cache itself, and several popular setups no longer leave the evidence it expects. The most common one this year is LiteSpeed Cache, which stopped writing a drop-in file in version 7.4, so on those sites the only proof left is a response header. Custom proxy headers the test has never heard of, a homepage excluded from caching, and a homepage that redirects or returns an error all produce the same message on a site that is otherwise cached perfectly well.
Is page cache is not detected but the server response time is OK safe to ignore?
In practice it is usually safe to leave for a day, and it is not safe to leave forever. That exact wording is a recommendation, not a critical result, and it means the median of three homepage requests came back under 600 milliseconds. So visitors are not waiting today. The risk is what happens under load: an uncached page runs PHP on every visit, and the fast result was measured with one request at a time. A site that answers quickly alone can still queue badly when fifty people arrive together.
Does AHosting LiteSpeed hosting ever show page cache is not detected?
That said, it can, and it is worth being plain about when. AHosting WordPress plans run LiteSpeed with LSCache available, and a cached homepage there is marked with a response header the test recognizes. The message appears when the LiteSpeed Cache plugin is not active on the site, when the homepage has been excluded from caching, or when something on the front page sets a cookie that stops it being stored. None of those is a server fault, and each one is visible in the response headers within a minute of looking.
Page cache vs object cache: which one does this Site Health check actually measure?
By contrast with how often the two are confused, this test measures only the page cache. A page cache stores the finished HTML so the server can skip WordPress entirely. An object cache stores the results of database queries so WordPress runs faster when it does run. Site Health checks the second one in a separate test with a separate message about a persistent object cache. Fixing one never clears the other, so read the heading of the notice before deciding which layer to work on.
LiteSpeed Cache vs a Cloudflare edge cache: which one does Site Health see?
Notably it sees whichever one answers the request its own server sends to the homepage, and that is not always the one visitors hit. The test fetches the public homepage address from inside the server. If that address resolves through the proxy, a Cloudflare HIT header can satisfy it; if it resolves straight back to the origin, only the origin cache can. Both headers are on the list. Read what the test itself was served rather than what your browser was served, because the two paths can differ.
Will an AHosting plan upgrade fix a slow page cache is not detected result in 2026?
Ultimately only if the slow half of the result is caused by the plan, and usually it is not. The critical version of this message means the median homepage response took 600 milliseconds or longer. A missing cache is the usual reason, and turning a cache on costs nothing. If the page is slow even when served from cache, the cause is in front of PHP rather than inside it. More processes and memory help an uncached site that is queuing under traffic, which is a real case but a different diagnosis.
Can I add my own cache header so the page cache check passes?
Indeed you can, and core provides a filter for exactly that purpose. The list of headers the test accepts is passed through site_status_page_cache_supported_cache_headers, so a site behind a proxy that reports its cache status under an unusual header name can register that header and a rule for reading it. Register the header your cache genuinely sends. Adding a header purely to satisfy the test hides the one signal the test exists to give you, which is whether visitors are being served from cache.
Does AHosting count cached pages against my entry process limit?
Fortunately not, and it is the practical reason a page cache matters more on shared hosting than the test result suggests. A page served from LSCache on an AHosting plan never starts PHP, so it consumes none of the concurrent PHP processes the plan allows. An uncached page consumes one for as long as it takes to build. That is why the same site can feel fine alone and stall under a burst of visitors: the limit that matters is concurrency, and caching is what keeps ordinary visits out of it.
Does page cache is not detected affect SEO or Core Web Vitals in 2026?
Interestingly the message itself affects nothing, because search engines never see Site Health. What they do see is the first byte of every page they crawl, and an uncached page is slower to produce that byte than a cached one. On a quiet site the difference can be small. On a busy one it compounds, because uncached pages queue behind each other for processes. So the notice is not a ranking problem, but the condition it describes can become one when traffic arrives.
Related posts:
 An Active PHP Session Was Detected: What WordPress Site Health Is Really Telling You, and How to Fix It on Shared Hosting
 One or More Recommended Modules Are Missing: How to Read the WordPress Site Health Warning and Fix It on Shared Hosting
 Autoloaded Options Could Affect Performance: How to Read the Site Health Warning and Clear It on Shared Hosting
 LiteSpeed Cache and Cloudflare: Fixing Double Caching Without Breaking Either (2026)